Full Report
The numbers behind Adobe Inc.: as-reported financial statements and company metrics for FY2021–FY2025, traced to the source filings, opened with the share-price history those statements have to justify. Every linked figure opens the exact page of the filing it was printed on, with the statement row highlighted. Amounts in US$ millions unless noted.
Reading notes: Reporting currency US dollars; all figures in millions except per-share data, as printed in Adobe's Forms 10-K. Adobe's fiscal year ends on the Friday nearest November 30 (fiscal 2025 ended November 28, 2025). FY2025, FY2024 and FY2023 columns are the three years printed in the FY2025 Form 10-K (income statement and cash flows). FY2023 balance-sheet figures are the comparative column of the FY2024 Form 10-K (the FY2025 10-K balance sheet shows only FY2025 and FY2024). FY2022 and FY2021 columns are the two most recent years printed in the FY2022 Form 10-K (FY2021 is that filing's comparative column; Adobe also filed a standalone FY2021 10-K with identical audited figures). Segment revenue and gross profit use Adobe's three reportable segments — Digital Media, Digital Experience, and Publishing and Advertising — as disclosed in the segment note. The income statement itself disaggregates revenue only by Subscription / Product / Services and other.
Share Price — Full Available History — 37 Years
The stock closed at $237.25 on Jul 17, 2026 — up 299,830% over the window shown (+24.5% a year), trading between $0.07 and $688.37. At that close the stock trades at 14× FY2025 diluted EPS as reported below.
Source: market price feed, monthly closes, sampled from 9,202 source observations, Jan 1990–Jul 2026. Price return only, excludes dividends. Prices are split-adjusted (1:2 on Aug 11, 1993; 1:2 on Oct 27, 1999; 1:2 on Oct 25, 2000; 1:2 on May 24, 2005).
FY2025 at a Glance
Revenue (US$ millions)
Operating income (US$ millions)
Net income (US$ millions)
Diluted EPS
Source: FY2025 consolidated statements [1] [2]. Click any linked figure to open the filing page with the row highlighted.
Revenue by Segment
| Revenue by Segment | FY2021 | FY2022 | FY2023 | FY2024 | FY2025 |
|---|---|---|---|---|---|
| Digital Media | 11,520 | 12,842 | 14,216 | 15,864 | 17,649 |
| Digital Experience | 3,867 | 4,422 | 4,893 | 5,366 | 5,864 |
| Publishing and Advertising | 398 | 342 | 300 | 275 | 256 |
| Total revenue | 15,785 | 17,606 | 19,409 | 21,505 | 23,769 |
| Total revenue growth, derived | — | +11.5% | +10.2% | +10.8% | +10.5% |
Source: Note 14 Segment and Geographic Information; Consolidated Statements of Income [3] [1] [4] [2]. Click any linked figure to open the filing page with the row highlighted.
Gross Profit by Segment
| Gross Profit by Segment | FY2021 | FY2022 | FY2023 | FY2024 | FY2025 |
|---|---|---|---|---|---|
| Digital Media | 11,091 | 12,281 | 13,551 | 15,184 | 16,808 |
| Digital Experience | 2,546 | 2,920 | 3,290 | 3,777 | 4,239 |
| Publishing and Advertising | 283 | 240 | 214 | 186 | 171 |
| Total gross profit | 13,920 | 15,441 | 17,055 | 19,147 | 21,218 |
Source: Note 14 Segment and Geographic Information [3] [1] [4] [2]. Click any linked figure to open the filing page with the row highlighted.
Income Statement
Source: Consolidated Statements of Income [1] [2]. Click any linked figure to open the filing page with the row highlighted.
Columns marked E are consensus analyst estimates shown alongside reported results for direct comparison; they are not company guidance.
Estimate source: Yahoo Finance analyst consensus, as of 2026-07-18. Estimate figures link to the consensus source, not to filing pages.
Balance Sheet
Source: Consolidated Balance Sheets [5] [6] [7]. Click any linked figure to open the filing page with the row highlighted.
Cash Flow
Source: Consolidated Statements of Cash Flows [8] [9]. Click any linked figure to open the filing page with the row highlighted.
Digital Media ARR Engine
| Digital Media ARR Engine | FY2021 | FY2022 | FY2023 | FY2024 | FY2025 |
|---|---|---|---|---|---|
| Digital Media ARR (ending) | 12,240 | 13,970 | 15,170 | 17,330 | 19,200 |
| Digital Media ARR growth (YoY) | 19.0% | 15.0% | 14.0% | 13.0% | 11.5% |
| Creative ARR | 10,300 | 11,600 | 12,370 | 13,850 | — |
| Document Cloud ARR | 1,930 | 2,370 | 2,810 | 3,480 | — |
| Total Adobe ending ARR | — | — | — | — | 25,200 |
Source: company filings [10] [11] [12] [13]. Click any linked figure to open the filing page with the row highlighted.
Recurring Revenue Backlog
| Recurring Revenue Backlog | FY2021 | FY2022 | FY2023 | FY2024 | FY2025 |
|---|---|---|---|---|---|
| Subscription revenue | 14,573 | 16,388 | 18,284 | 20,521 | 22,904 |
| Subscription revenue (% of total) | 92.0% | 93.0% | 94.0% | 95.0% | 96.0% |
| Remaining performance obligations | 13,990 | 15,190 | 17,220 | 19,960 | 22,520 |
Source: company filings [14] [15] [16]. Click any linked figure to open the filing page with the row highlighted.
Revenue by Geography
| Revenue by Geography | FY2021 | FY2022 | FY2023 | FY2024 | FY2025 |
|---|---|---|---|---|---|
| Americas | 8,996 | 10,251 | 11,654 | 12,891 | 14,120 |
| EMEA | 4,252 | 4,593 | 4,881 | 5,554 | 6,289 |
| APAC | 2,537 | 2,762 | 2,874 | 3,060 | 3,360 |
Source: company filings [17] [18]. Click any linked figure to open the filing page with the row highlighted.
Workforce Capital Return
| Workforce Capital Return | FY2021 | FY2022 | FY2023 | FY2024 | FY2025 |
|---|---|---|---|---|---|
| Employees (headcount) | 25,988 | 29,239 | 29,945 | 30,709 | 31,360 |
| Stock-based compensation | 1,090 | 1,440 | 1,718 | 1,833 | 1,942 |
| Remaining stock repurchase authorization | — | — | — | — | 5,900 |
Source: company filings [19] [20] [21] [22]. Click any linked figure to open the filing page with the row highlighted.
Long-Term Record
| Fiscal year | Total revenue | Operating income | Net income | Diluted earnings per share | Operating cash flow |
|---|---|---|---|---|---|
| FY2016 | 5,854 | 1,494 | 1,169 | 2.32 | 2,200 |
| FY2017 | 7,302 | 2,168 | 1,694 | 3.38 | 2,913 |
| FY2018 | 9,030 | 2,840 | 2,591 | 5.20 | 4,029 |
| FY2019 | 11,171 | 3,268 | 2,951 | 6.00 | 4,422 |
| FY2020 | 12,868 | 4,237 | 5,260 | 10.83 | 5,727 |
| FY2021 | 15,785 | 5,802 | 4,822 | 10.02 | 7,230 |
| FY2022 | 17,606 | 6,098 | 4,756 | 10.10 | 7,838 |
| FY2023 | 19,409 | 6,650 | 5,428 | 11.82 | 7,302 |
| FY2024 | 21,505 | 6,741 | 5,560 | 12.36 | 8,056 |
| FY2025 | 23,769 | 8,706 | 7,130 | 16.70 | 10,031 |
Source: consolidated statements across filings; older years from the standardized feed [8] [1] [9] [2]. Click any linked figure to open the filing page with the row highlighted.
Analyst Consensus
Current price
Mean target
Median target
High target
Low target
Estimate source: Yahoo Finance analyst consensus, as of 2026-07-18. Estimate figures link to the consensus source, not to filing pages.
Traceability
349 of 378 figures on this page (92%) link to the filing page where they are printed — click a linked figure to open the source PDF at that page with the row highlighted. Unlinked figures come from standardized data feeds or pre-filing years.
Reporting currency US dollars; all figures in millions except per-share data, as printed in Adobe's Forms 10-K. Adobe's fiscal year ends on the Friday nearest November 30 (fiscal 2025 ended November 28, 2025).
FY2025, FY2024 and FY2023 columns are the three years printed in the FY2025 Form 10-K (income statement and cash flows). FY2023 balance-sheet figures are the comparative column of the FY2024 Form 10-K (the FY2025 10-K balance sheet shows only FY2025 and FY2024).
FY2022 and FY2021 columns are the two most recent years printed in the FY2022 Form 10-K (FY2021 is that filing's comparative column; Adobe also filed a standalone FY2021 10-K with identical audited figures).
Segment revenue and gross profit use Adobe's three reportable segments — Digital Media, Digital Experience, and Publishing and Advertising — as disclosed in the segment note. The income statement itself disaggregates revenue only by Subscription / Product / Services and other.
FY2016–FY2020 long-term-record figures are from the standardized SEC XBRL data feed and are shown without page links.
Remaining performance obligations (RPO) were approximately $22.52 billion as of November 28, 2025 (FY2025 10-K, Note on Deferred Revenue and Remaining Performance Obligations); disclosed as a single-year prose figure, so not tabulated as a multi-year KPI.
The FY2024 'Acquisition termination fee' of $1,000 million is the one-time fee Adobe paid on the terminated Figma acquisition; it appears as a discrete operating-expense line only in the FY2024/FY2025 10-K income statements.
Adobe Inc.'s management explains the business in its own materials. The slides below do the most of that work, pulled from the documents preserved in Sources. Each source link opens the complete presentation at that slide in a new tab.
Investor Summit Q&A — 2026
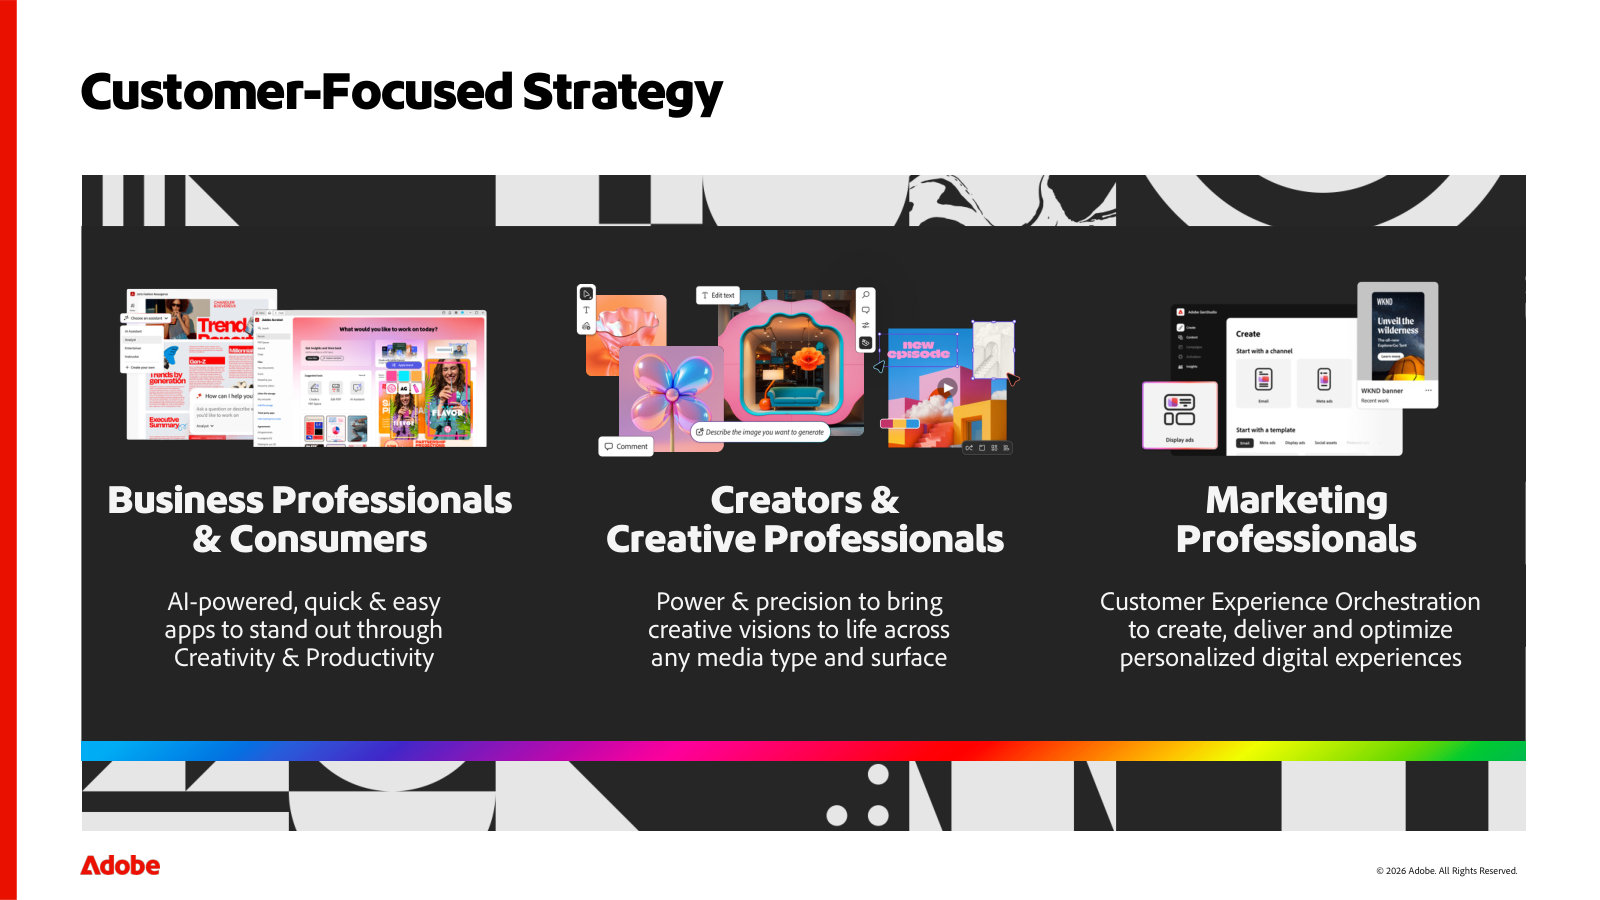
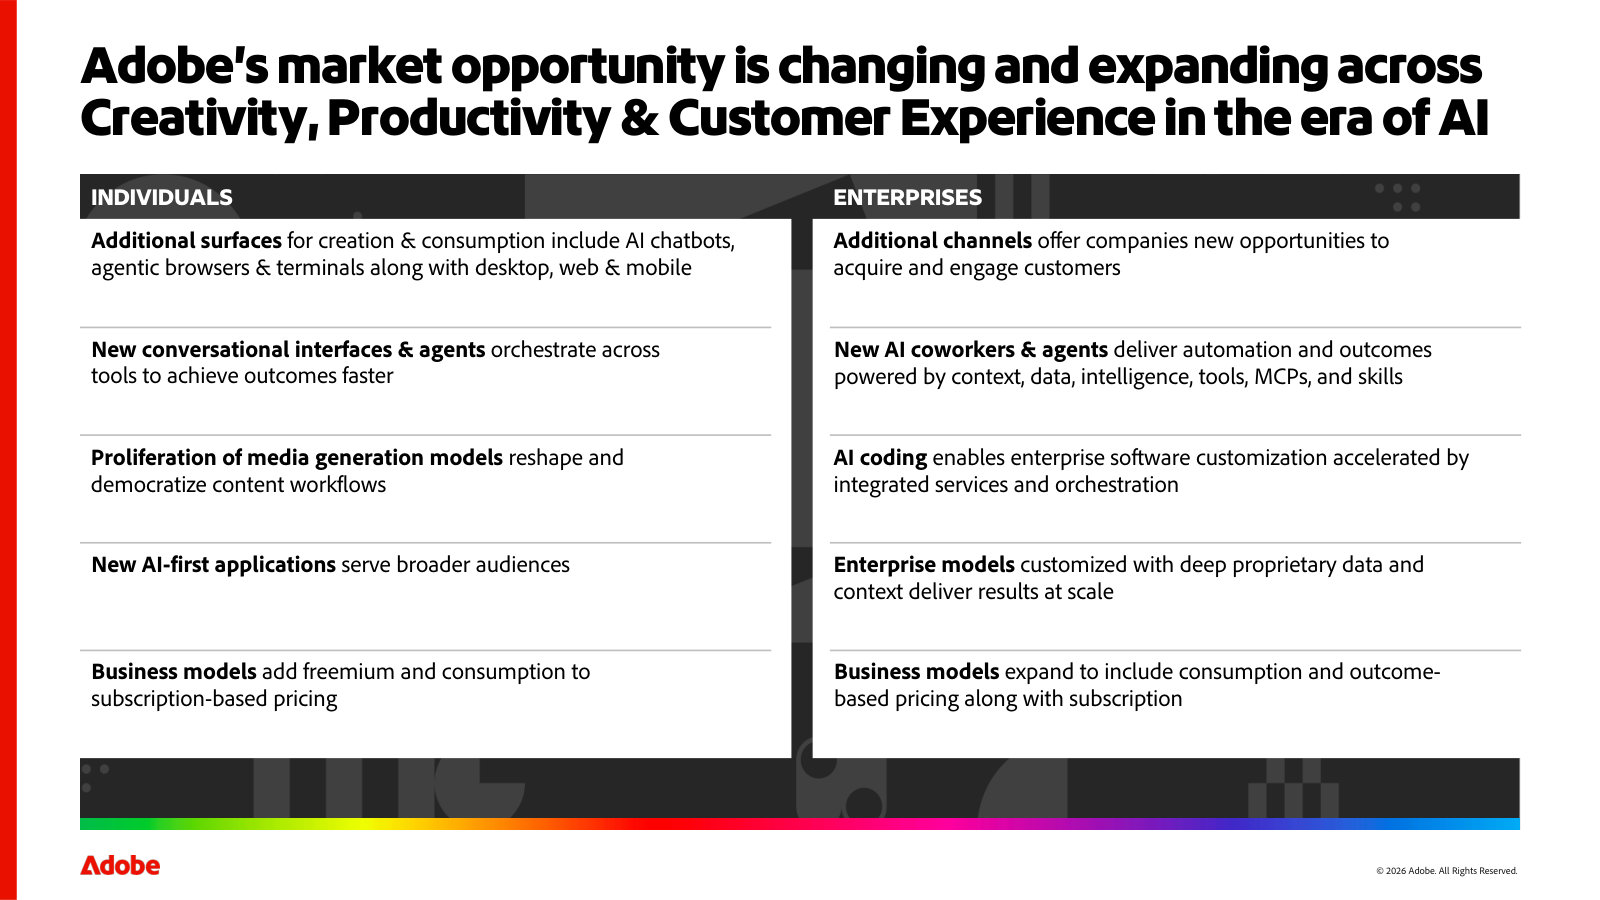
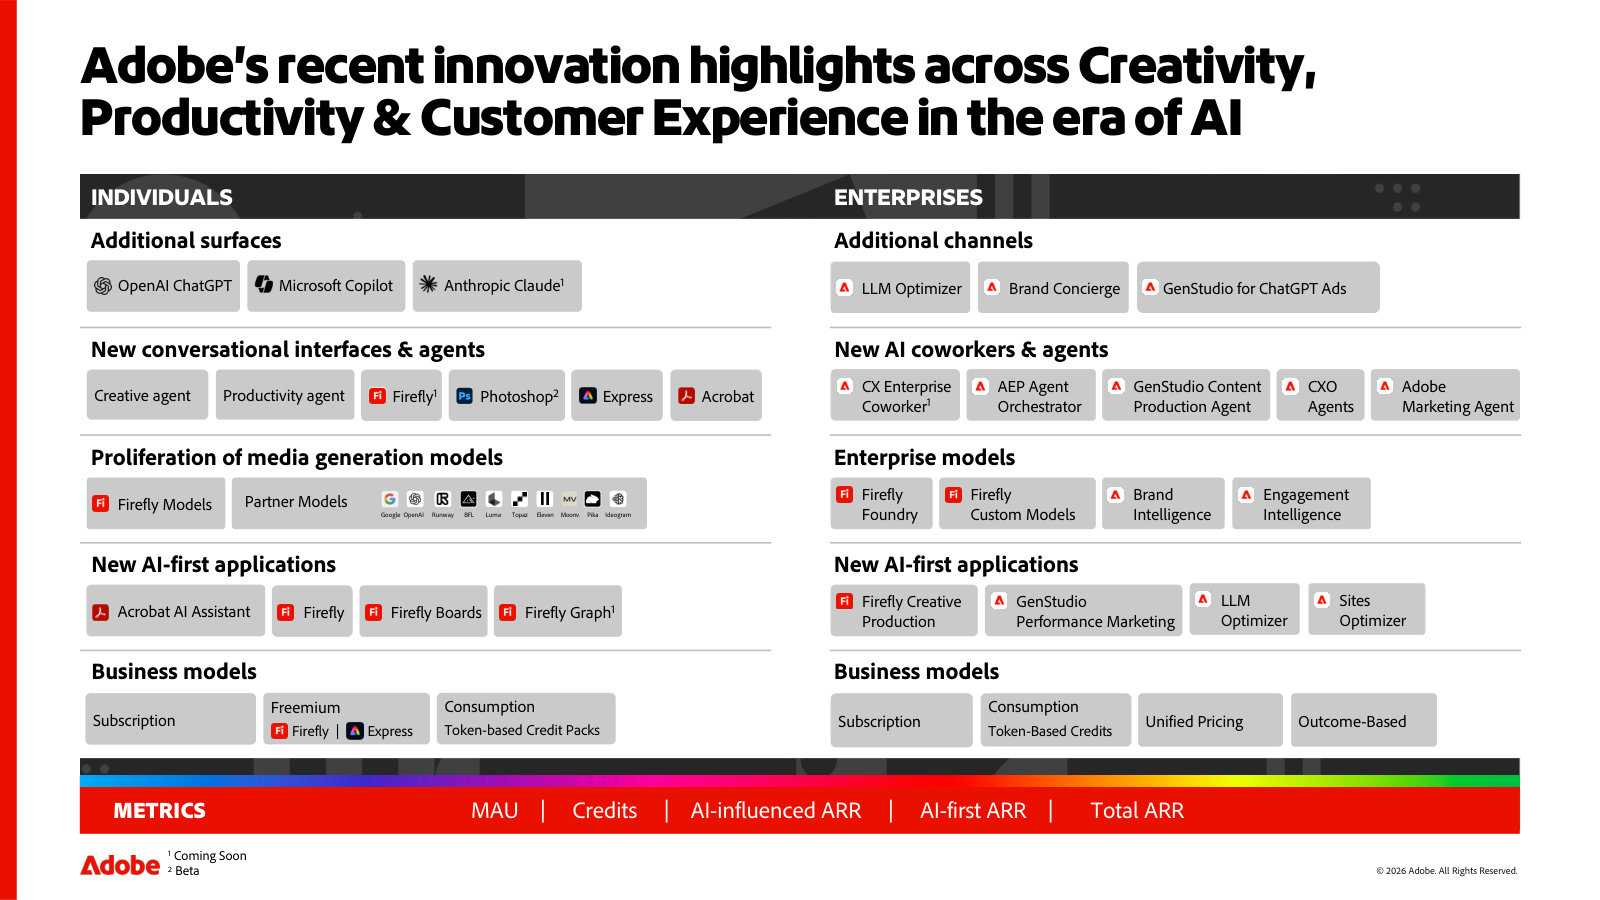
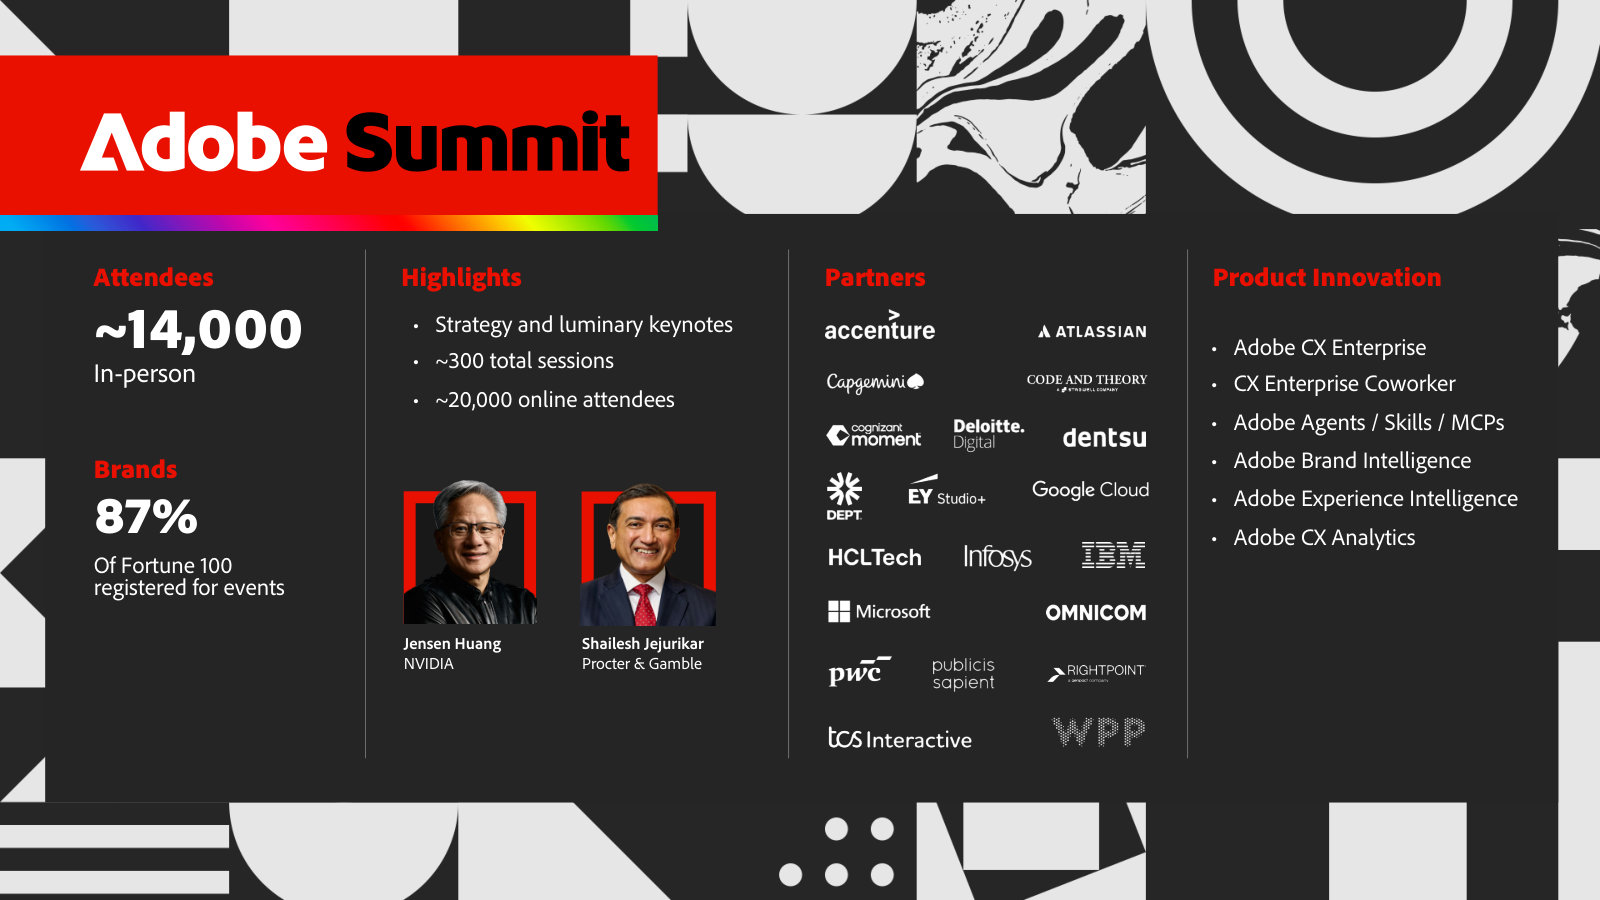
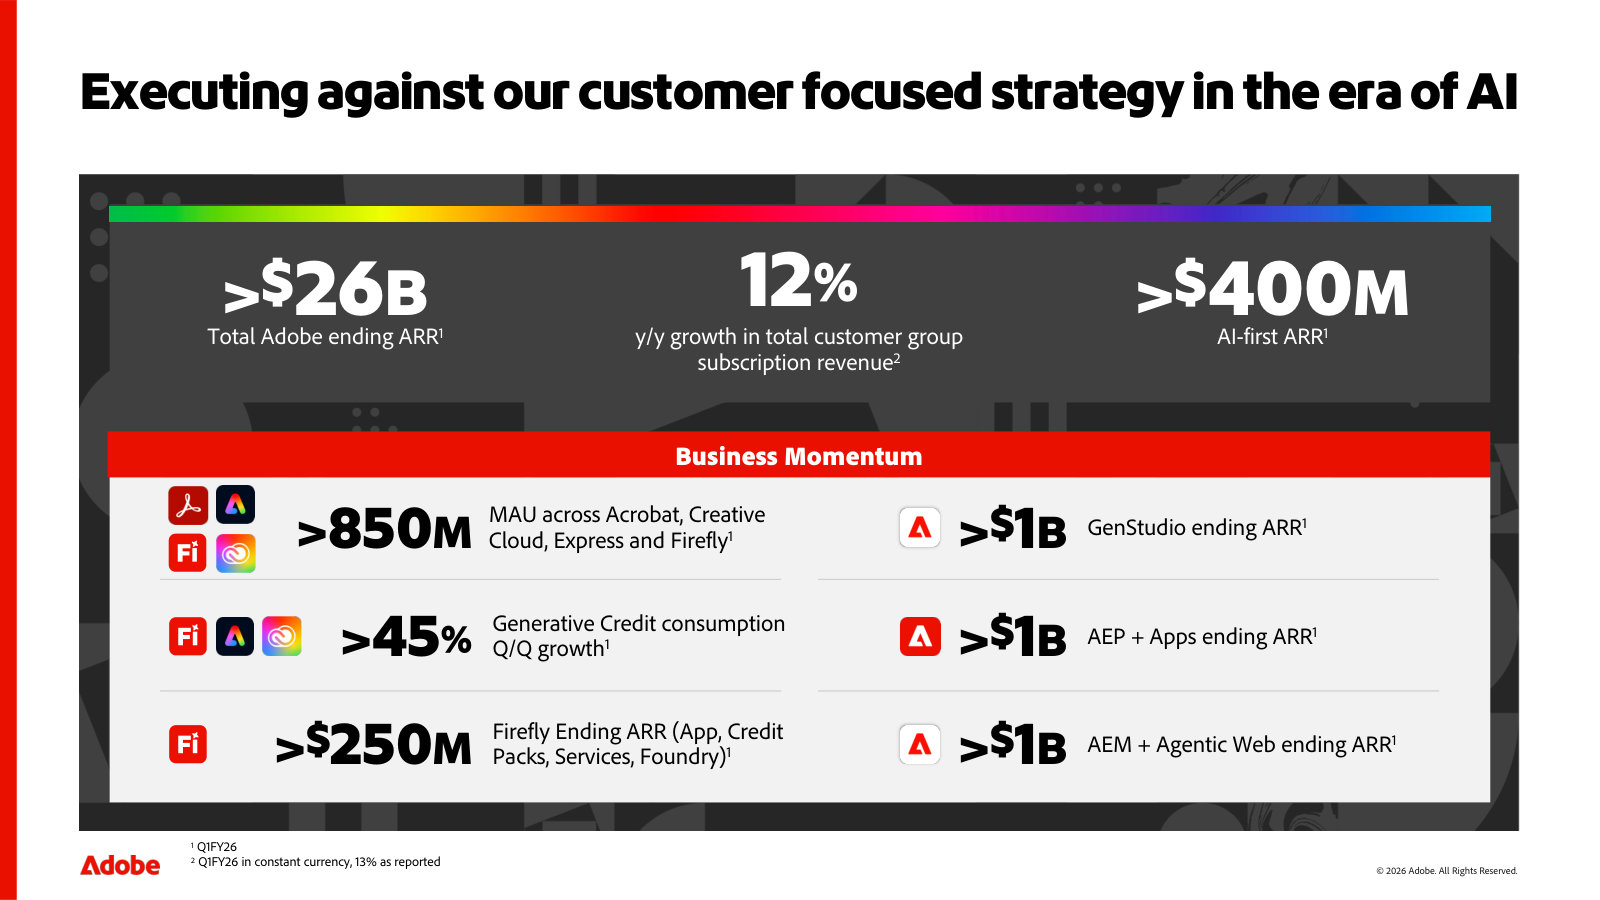
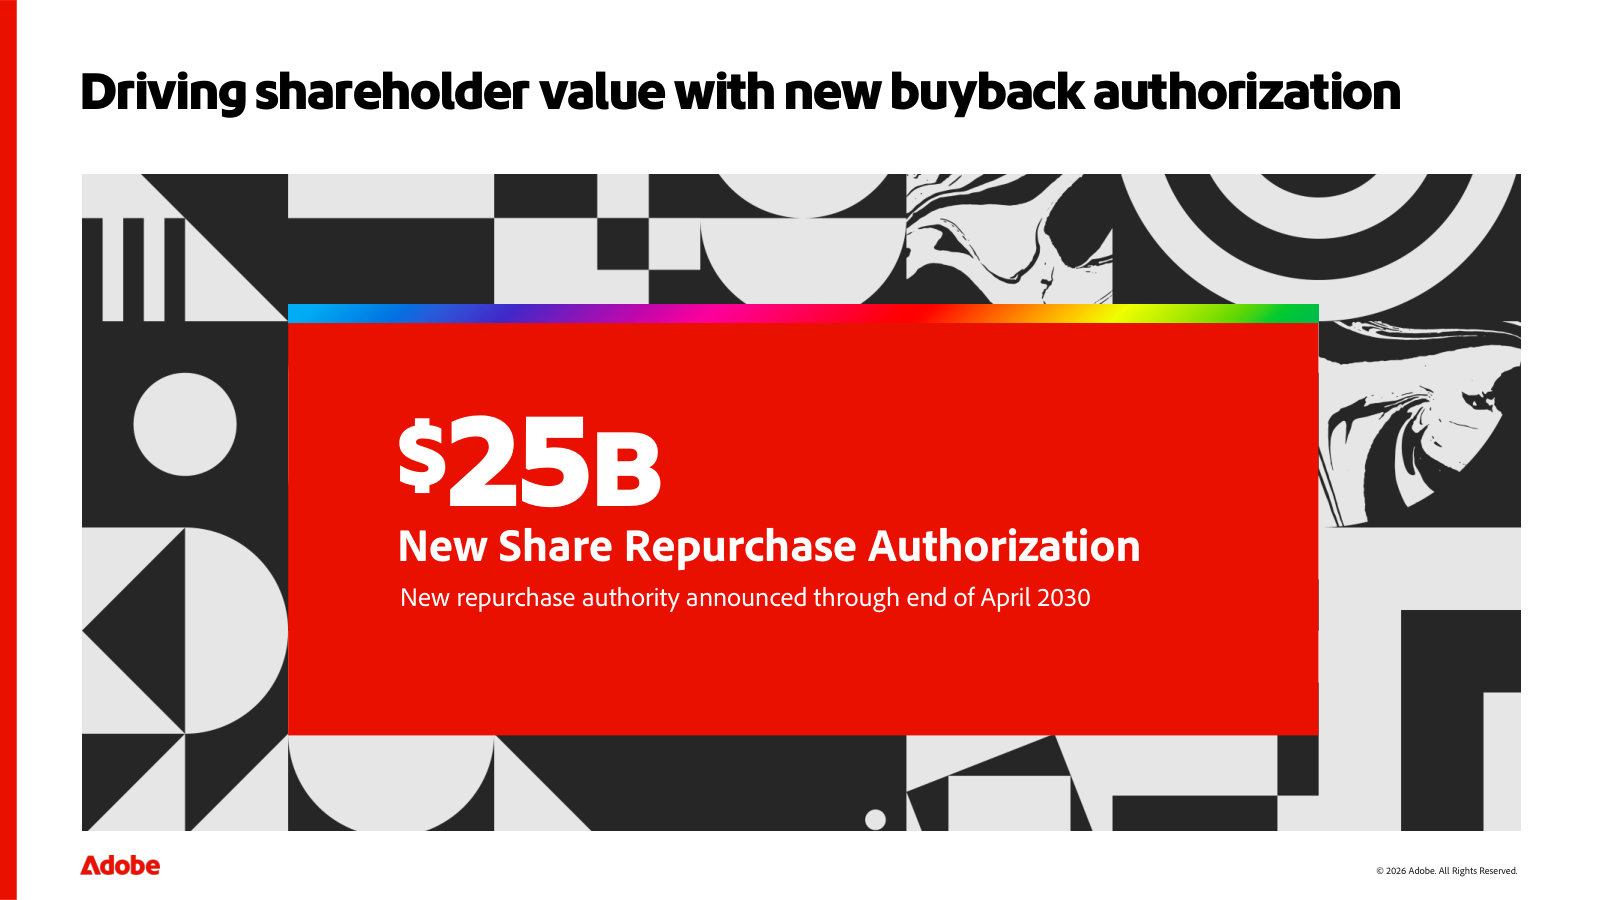
Management's fullest current overview — mission, the AI-era market opportunity, the product portfolio, business momentum and capital return. · Open the full document →

Q2 FY2026 Earnings Call — Q2 FY2026
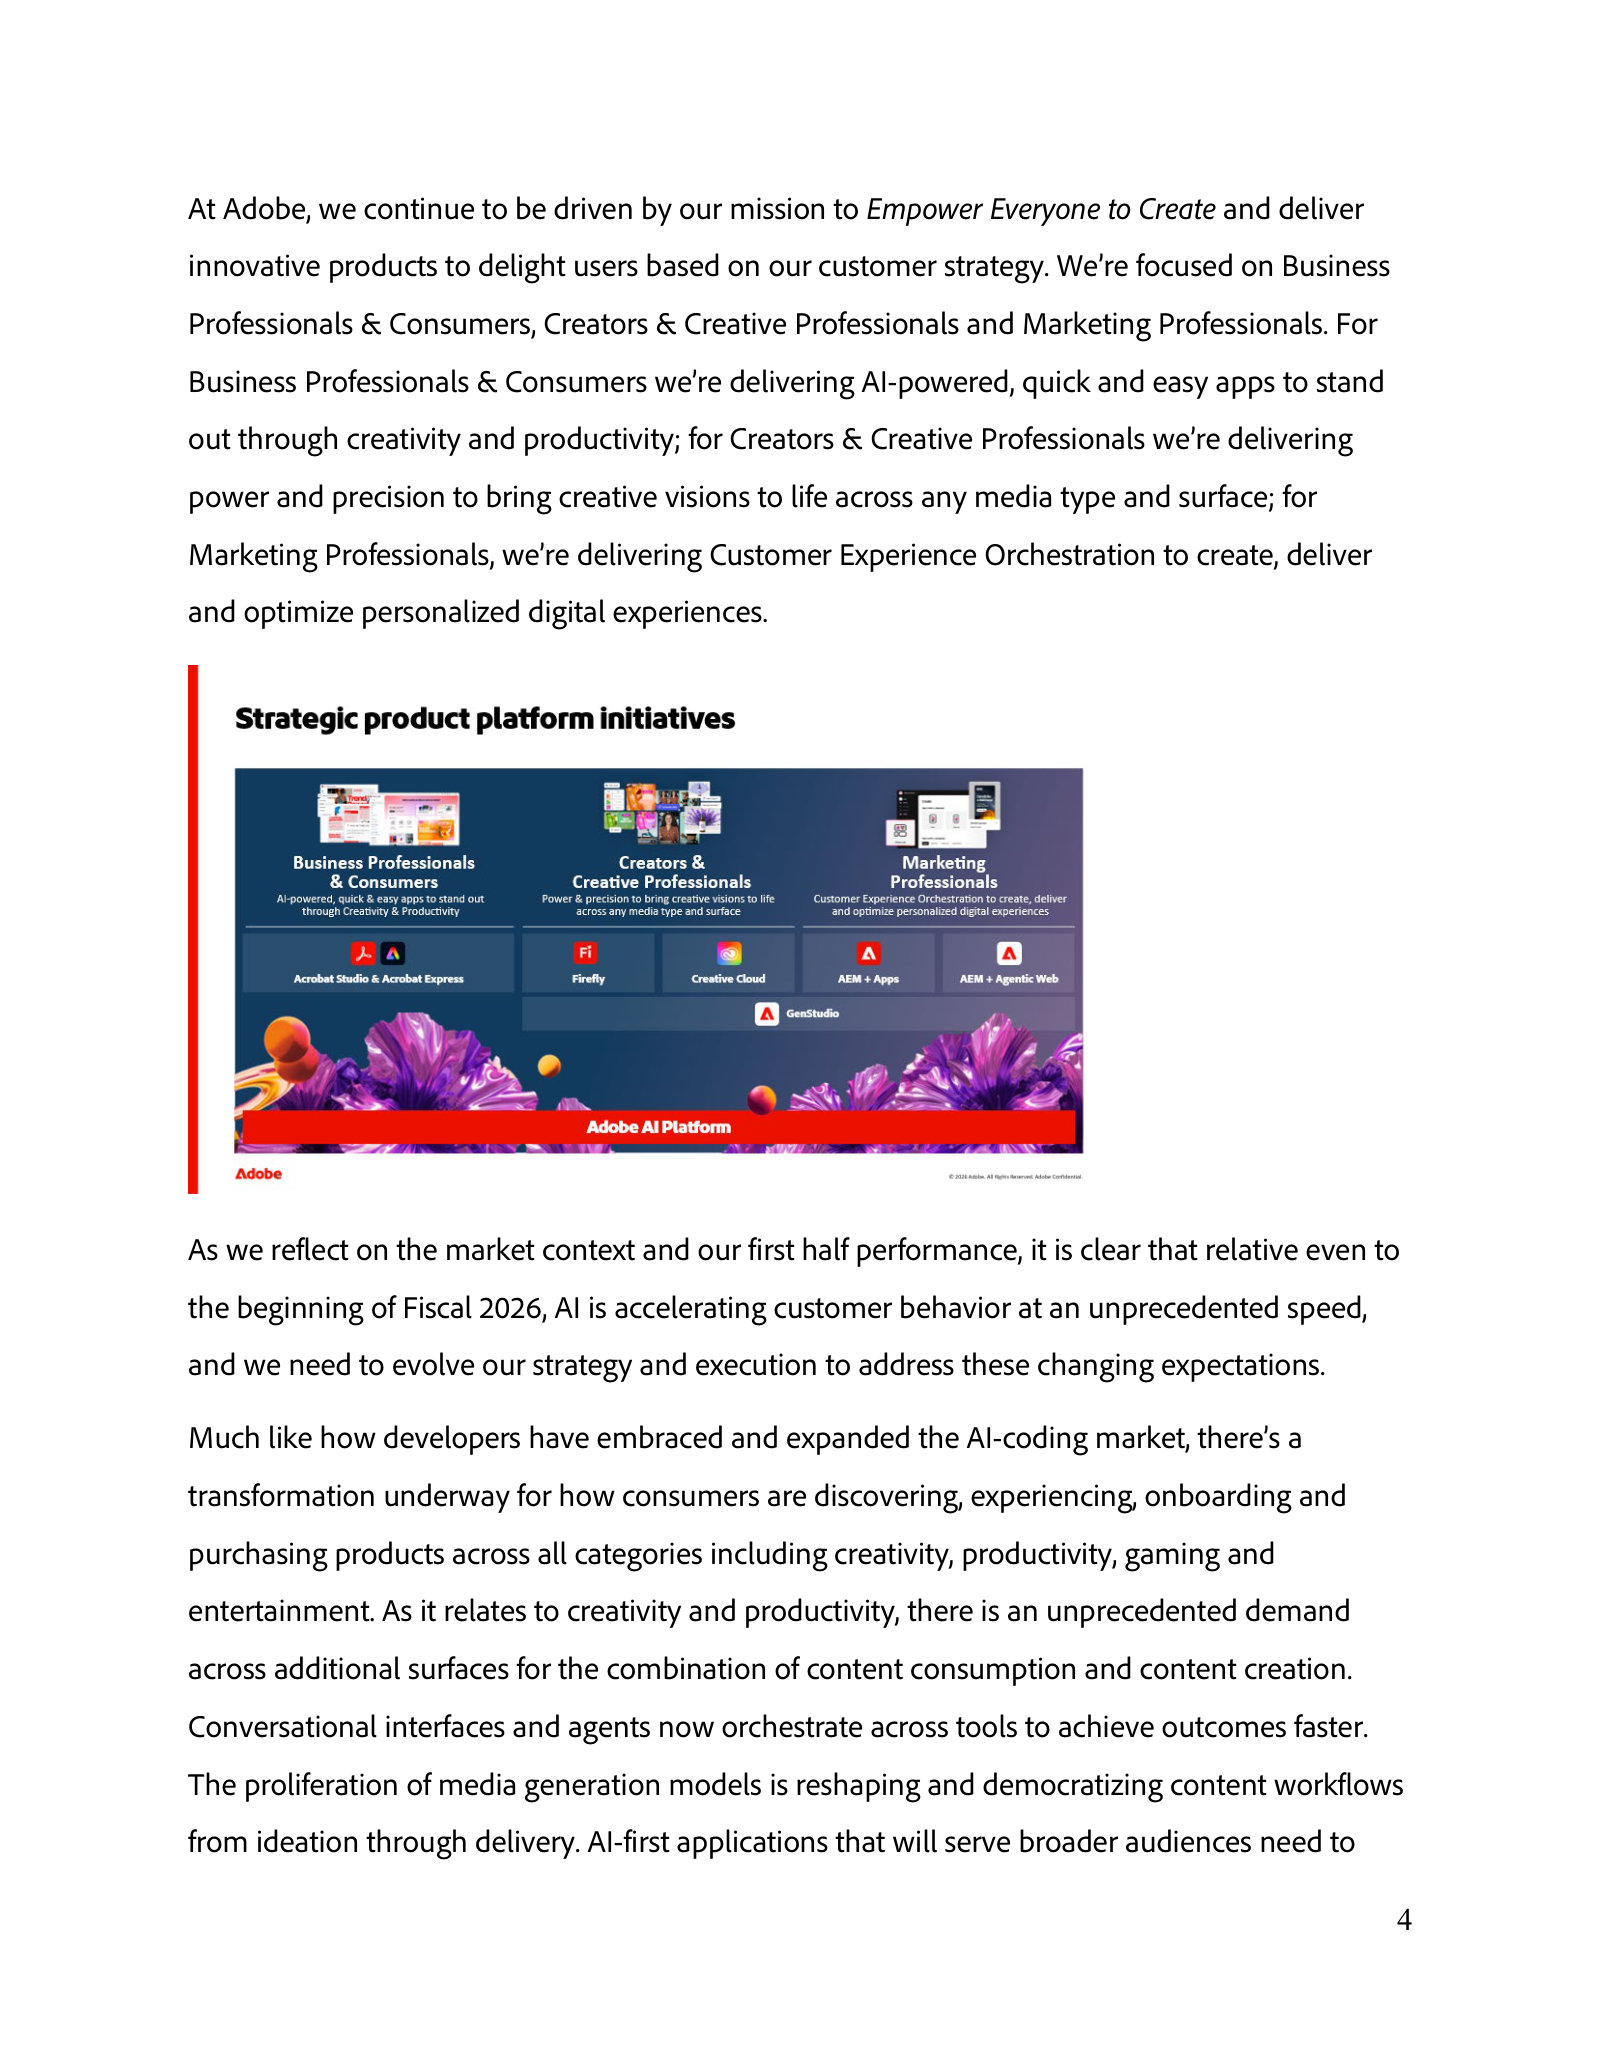
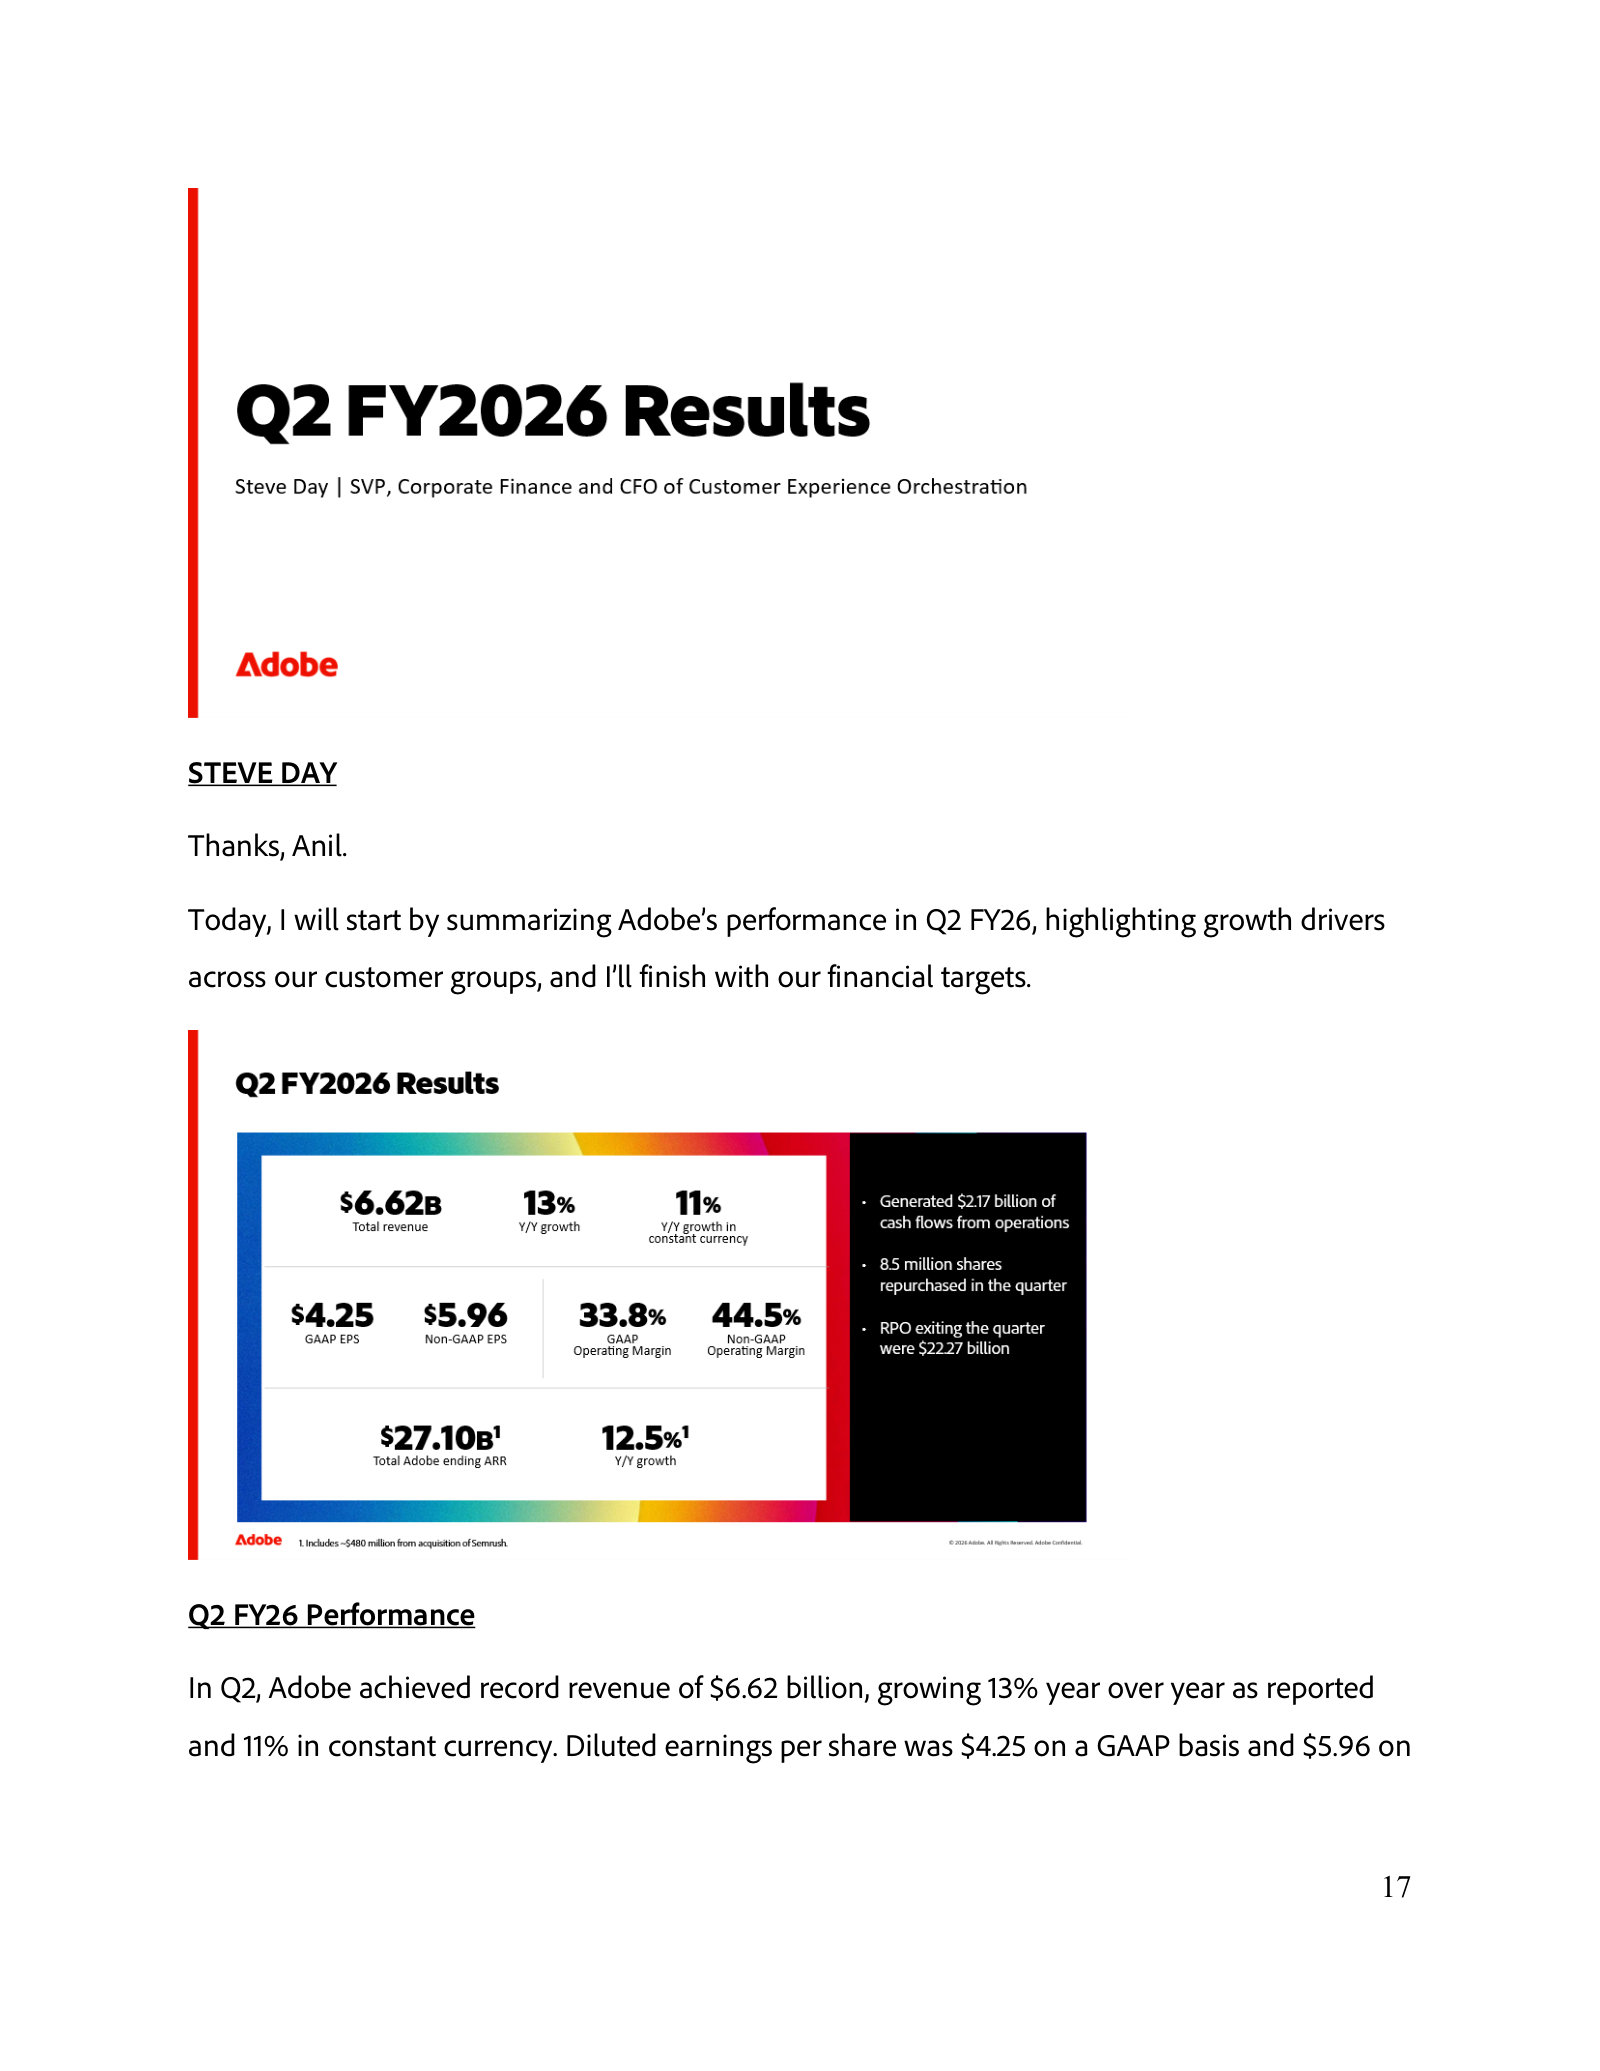
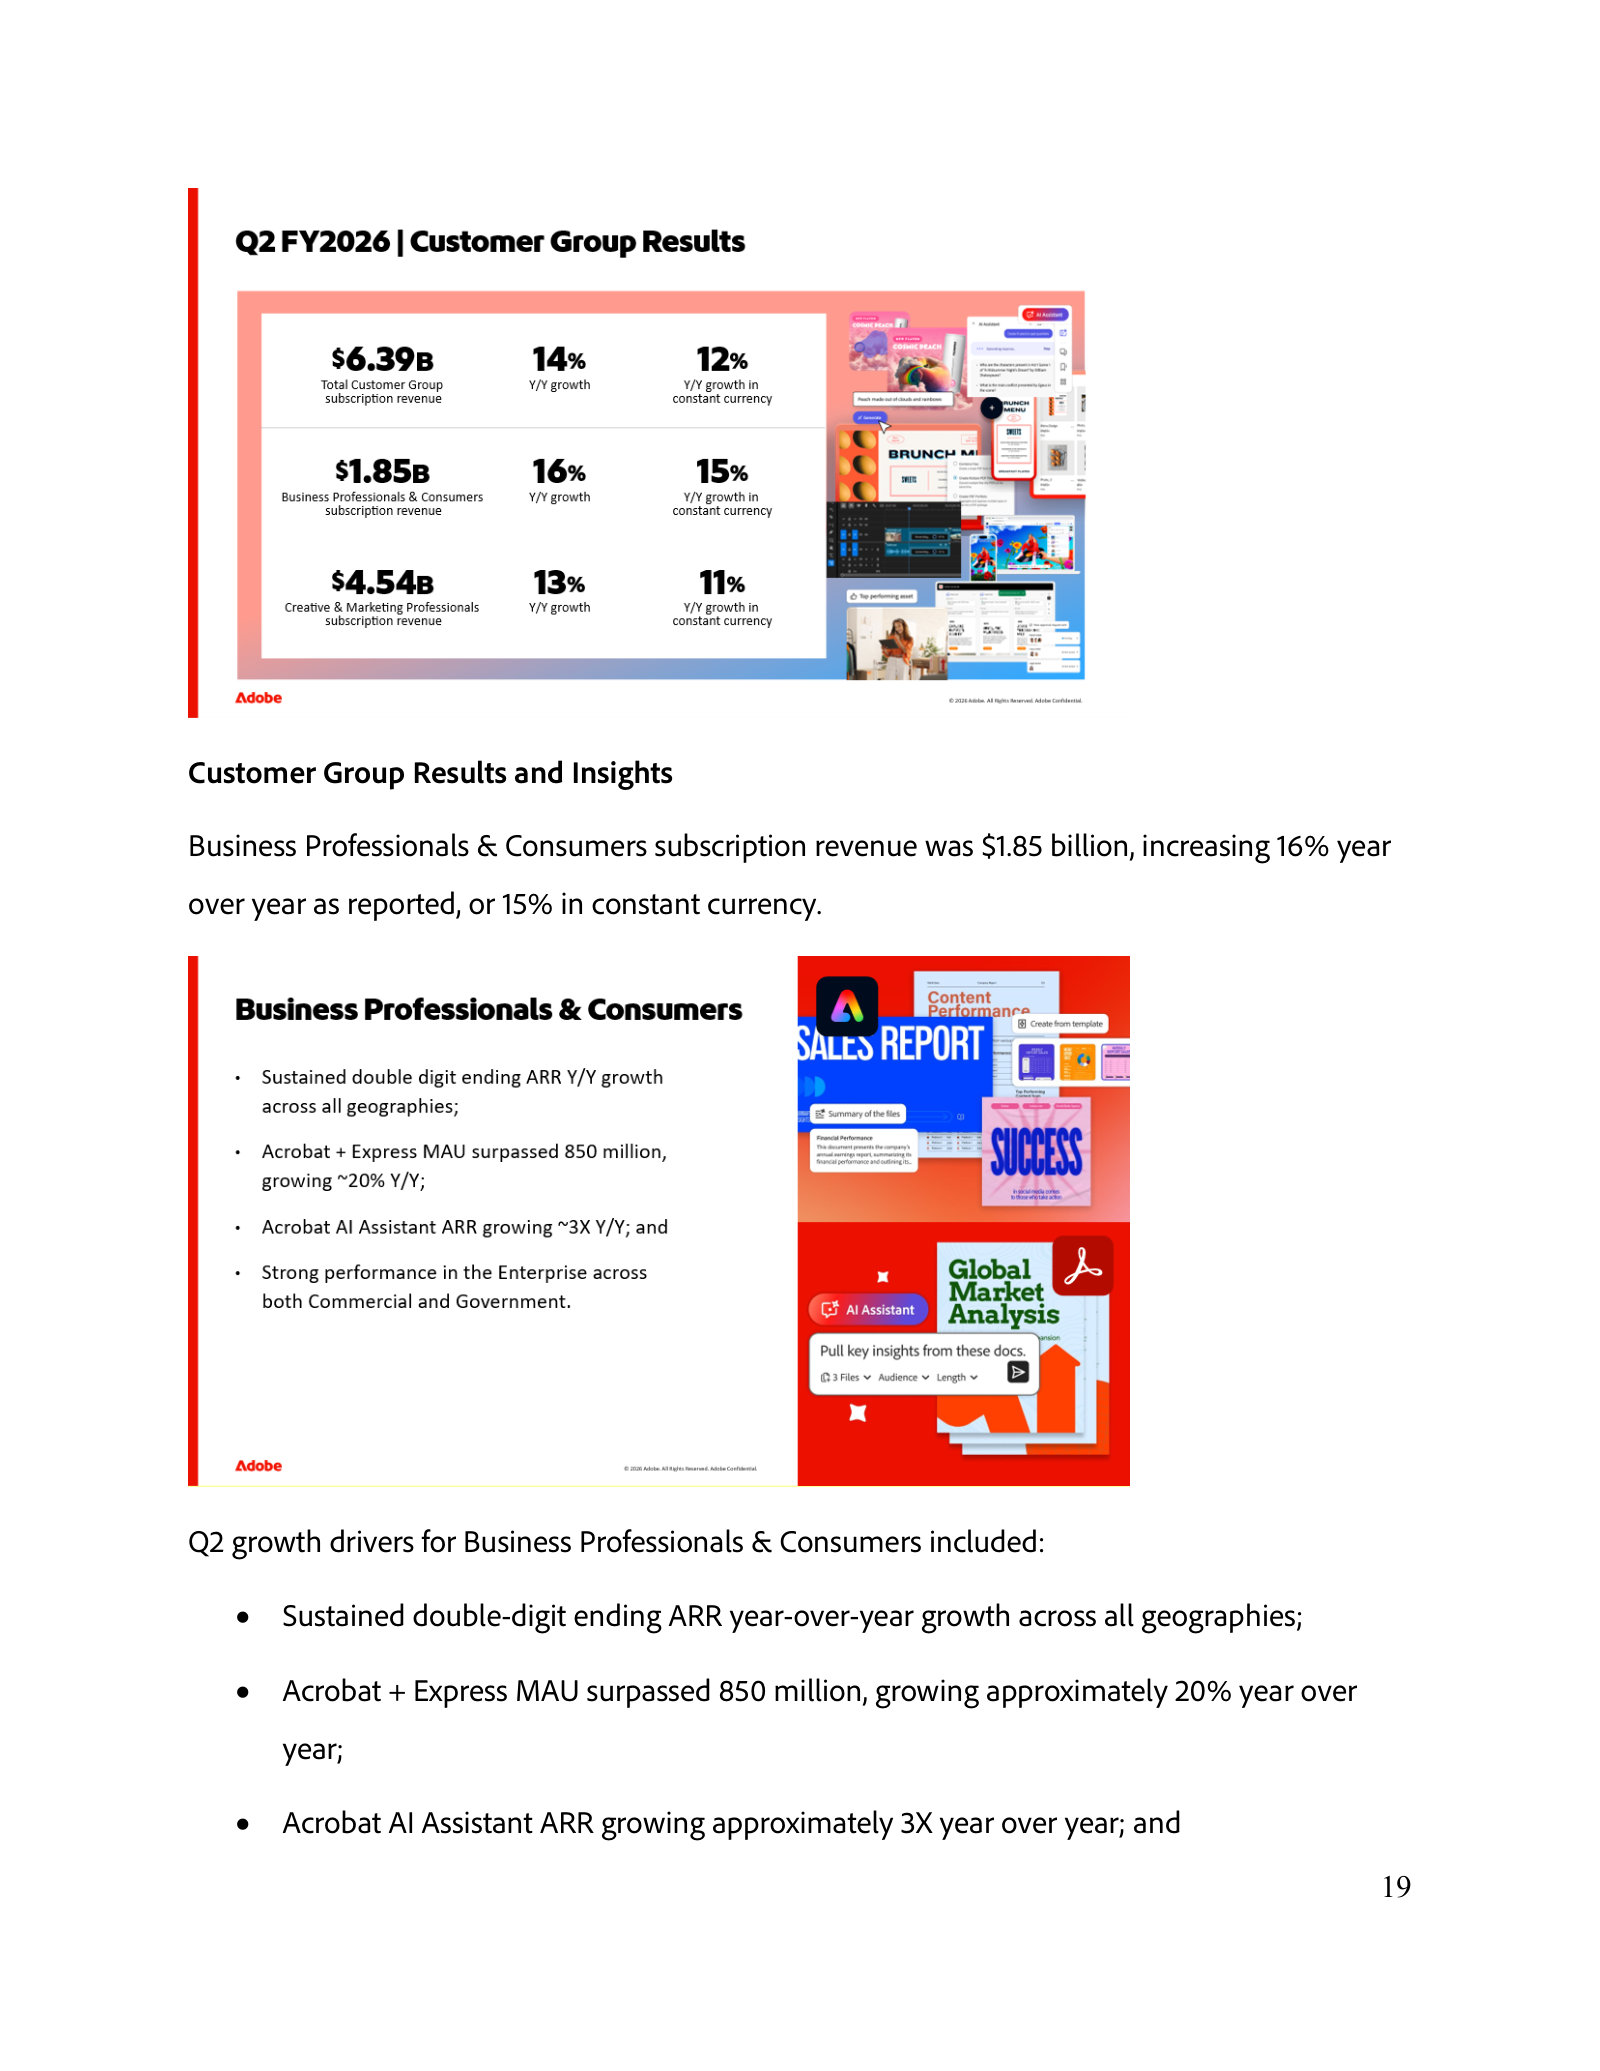
The latest quarterly deck: current financials, the product-to-segment map, and revenue split across the two reported customer groups. · Open the full document →
More from management
Q4 & Full-Year FY2025 Earnings Call — Q4 FY2025 · 29 pages · Full-year FY2025 results, the announced Semrush acquisition, and the initial FY2026 revenue, ARR and EPS targets management set. · Open →
Q4 & Full-Year FY2024 Earnings Call — Q4 FY2024 · 24 pages · The FY2024 full-year results and the FY2025 targets that framed the prior year's plan — a baseline for measuring progress. · Open →
Adobe Inc.'s management answers for the business every quarter. These are the exchanges that explain it best — verbatim, from the call transcripts preserved in Sources. Each link opens the full transcript at that page in a new tab.
Q2 FY2026 Earnings Call — June 11, 2026
The strategic reset: management chooses to route surging AI traffic into a free Firefly/Express funnel — knowingly cutting second-half ARR — while a CFO exit and a CEO succession are underway, and fields the sharpest 'why now, and what's the payback' pushback. · Open the full transcript →
The pivot thesis: AI is changing buyer behavior so fast that the near-term prize is free user acquisition, not immediate paid conversion.
Shantanu Narayen, Chair & CEO: As we reflect on the market context and our first half performance, it is clear that relative even to the beginning of fiscal 26, AI is accelerating customer behavior at an unprecedented speed and we need to evolve our strategy and execution to address these changing expectations. […] Big picture, the immediate opportunity for Adobe is to accelerate new user acquisition and lifetime value through a freemium offering.
p. 1 · Read in context →
The one number that anchors the bull case: AI-first ARR tripled year-over-year to over $500 million.
Shantanu Narayen, Chair & CEO: Adobe's AI innovation has driven an impressive 3x year-over-year increase in AI-first ARR to greater than $500 million. We believe now is the time to aggressively acquire the next generation of Adobe loyalists.
p. 2 · Read in context →
The candid cost and the leadership overhang: the freemium shift lowers 2H ARR, the CFO is departing, and a CEO search is live.
Shantanu Narayen, Chair & CEO: The strategic shift to acquire more freemium customers through Adobe and Firefly lowers our second half ARR growth expectations from individual subscribers. […] As we announced, Daniel Durn has decided to pursue a new opportunity outside the software industry. I would like to thank Daniel for his contributions to Adobe and wish him well. […] Given my decision to transition to Board Chair, I wanted to provide an update on the CEO search, which is progressing well.
p. 3 · Read in context →
How the funnel actually works: rank for an intent search ('summarize this PDF'), do the task free, build a habit, then paywall.
David Wadhwani, President of Creativity & Productivity: We see a shift to LLM usage driving intent-based search. Someone might type into a search engine, 'summarize this PDF.' We use SEO and SEM capabilities to rank high for that query. When the user clicks our link, we take them directly into Acrobat web with a single call to action: upload your PDF, and we summarize it for them. When we summarize it, we introduce them to the AI Assistant so they can ask questions. We use this process to let them build a habit before we start applying a paywall.
p. 8 · Read in context →
Q4 & FY2025 Earnings Call — December 10, 2025
The full-year proof-point call: FY25 revenue of $23.77B with AI-influenced ARR now over a third of the book, a record FY26 net-new-ARR guide, and the clearest walk-throughs of how Firefly Foundry and generative credits actually monetize. · Open the full transcript →
The FY25 scoreboard, framed around AI: record $23.77B revenue and $20.94 non-GAAP EPS, with AI-first ARR accelerating through the year.
Shantanu Narayen, CEO: In fiscal 2025, Adobe delivered significant AI-influenced and AI-first ending ARR, which accelerated through the year. We achieved record revenue of $23.77 billion and non-GAAP EPS of $20.94, which represents outstanding financial performance.
p. 1 · Read in context →
Firefly Foundry economics: a media customer spending ~$10M on core creative added ~$7M for custom-model services after a six-month sale.
David Wadhwani, President of Digital Media: let's say that that organization was spending $10 million with us ARR on our core creative products that we've been selling with them. We ran a sales process with them and gave engagement with them for about six months. We were able to sell them Firefly services Firefly Foundry for about $7 million, so pretty significant step up in terms of, you know, the engagement that we have with the customer.
p. 7 · Read in context →
The recurring bear case: when does all this AI usage finally show up as stable or accelerating ARR? Narayen argues Q4 is that inflection.
Keith Weiss (Morgan Stanley); Shantanu Narayen, CEO: When can we potentially see this sort of grow the totality or stabilize or accelerate the totality of growth? At Adobe. Meaning, another when we see a year where ARR growth is stable, right, on a year-on year basis or actually improving, because I think that's what investors really wanna see to get more confident in the stock and start revisiting the stock and coming back to the shares? […] Q4 was a really strong quarter. And frankly, starting to be this inflection in terms of as we see the leading indicators. What is happening across the leading indicators. You know, which gives us a lot of confidence.
p. 9 · Read in context →
How generative AI monetizes: base credits per plan, then upgrades or add-on packs; a multiplier of apps, media, use cases and models.
David Wadhwani, President of Digital Media: we introduced, generative credits a few years ago when we introduced, generative AI into our products. And customers get credits in a couple of different ways. First, you know, all of our plans now come with some base level of credit, access. And, of course, higher-end plans include more credits. The second thing is that when customers deplete their credits, they can get more credits in one of two ways. They can upgrade to a higher-end plan, and or they can purchase generative credit add-on pack. And as we think about the growth algorithm associated with this, it's really a multiplier across four different things. First of all, the number of apps that have these generative capabilities, times the number of media types that we support, times the number of use cases and workflows that we've integrated these into, times the number of models that we have that people are able to use.
p. 11 · Read in context →
Q4 & FY2024 Earnings Call — December 11, 2024
A record year that the market hated: after $2B in net-new Digital Media ARR, the FY25 guide implied deceleration and the stock sank. Home to the bluntest 'is there a leak in the bucket?' challenge and Adobe's clearest growth-algorithm answer. · Open the full transcript →
The paradox in one line: a record FY24 — $21.5B revenue and the first-ever $2B of net-new Digital Media ARR — set against a falling stock.
Shantanu Narayen, CEO: 2024 was a year of records for Adobe. We achieved record revenue of $21.51 billion, representing 11% year-over-year growth. […] We had several new milestones with our AI innovations enabling us to add more than $2 billion in digital media net new ARR and surpass $1 billion in the ending book of business for Adobe Experience Platform and native apps.
p. 1 · Read in context →
The Digital Media growth algorithm, 'p times q plus v' — new users, price/value, enterprise value — and why FY25 tilts to new users.
David Wadhwani, President of Digital Media: We've talked about this in the context of p times q plus v in the past. You know, where p is new users bringing in more people into the franchise. […] the composition of growth is going to be a little different next year compared to FY2024. Again, the growth algorithm is new users, new products, and value and pricing. New users and new products will be a more significant part of the mix as we go into FY2025.
p. 7 · Read in context →
Guidance philosophy on AI: 'consumption' feeds ARR mainly through pricing tiers, not a metered model customers have to watch.
Keith Bachman (BMO); Shantanu Narayen, CEO: is that gonna be a contributor towards ARR growth, or should investors really be thinking about trying to match my seats, if you will, and really shouldn't it be about consumption being additive growth in 2025. […] you're gonna see, quote-unquote, consumption, add to ARR, in two or maybe three ways more so in 2025 than in 2024. […] So the intention is that consumption is what's driving the increased ARR, but it may be as a result of tier in the pricing rather than a consumption model where people actually have to monitor it.
p. 11 · Read in context →
Q1 FY2024 Earnings Call — March 14, 2024
The first call after the Figma deal collapsed — the $1B breakup fee lands this quarter — and the Q&A is dominated by the existential question of the era: does generative AI expand Adobe's market or hollow out its tools and seats? · Open the full transcript →
The bill for the failed $20B bet: a $1B Figma termination payment that cut GAAP EPS by $2.19 and a matching hit to operating cash flow.
Dan Durn, CFO: GAAP EPS came in lower due to the $1 billion payment resulting from the termination of the Figma transaction. Absent the termination payment, our cash flows from operations would have been $1 billion more, and GAAP EPS would have been $2.19 higher.
p. 4 · Read in context →
AI monetization, three ways: generative packs in Creative Cloud, a monthly Acrobat AI Assistant add-on, metered custom models in enterprise.
Shantanu Narayen, CEO: we have the generative packs, as you know, in Creative Cloud. I think you will see us more and more have that as part of the normal pricing and look at pricing because that's the way in which we want to continue to see people use it. I think in Acrobat, as you've seen, we are not actually using the generative packs. We're going to be using more of an AI Assistant model, which is a monthly model. As it relates to the Enterprise, we have both the ability to do custom models, which depends on how much content that they are creating, as well as an API and metering that we've rolled out and we've started to sell that as part of our GenStudio solution.
p. 8 · Read in context →
The core bull-vs-bear pivot: does AI raise or shrink Adobe's seat count? Narayen argues more models mean more interfaces, not fewer.
Keith Weiss (Morgan Stanley); Shantanu Narayen, CEO: The primary concern I hear from many is whether the emergence of AI and the growing number of models, whether for image or video, will lead to an increase or decrease in the number of seats for Adobe and beyond. I firmly believe that as we discuss these models and interfaces for creative content, the number of these interfaces will definitely rise. Therefore, Adobe must seize this significant opportunity. Overall, larger models will create even more opportunities for interfaces, and I think we are particularly well-suited to capitalize on that.
p. 14 · Read in context →
Q3 FY2022 Earnings Call — September 15, 2022
The landmark that set the terms of debate for years: the day Adobe announced its ~$20B bid for Figma. Management lays out the 'creativity on the web' rationale while analysts hammer the price, the dilution, and whether the organic engine still works. · Open the full transcript →
The announcement and the asset: a ~$400M-ARR, >150%-net-retention web design platform, bought to accelerate creativity on the web.
Shantanu Narayen, Chairman & CEO; David Wadhwani, President of Digital Media: I'm thrilled to share that today we announced our intention to acquire Figma, a leading web-first design platform that will help us accelerate this vision. […] Figma is expected to add approximately $200 million in net new ARR this year, surpassing $400 million in total ARR exiting 2022 with greater than 150% net-dollar retention rate. With the total addressable market of $16.5 billion by 2025, Figma is just getting started.
p. 3 · Read in context →
The terms that spooked the market: ~$20B, half cash/half stock, dilutive to non-GAAP EPS for two years, accretive only exiting year three.
Dan Durn, CFO: we've agreed to acquire Figma for approximately $20 billion comprised of approximately half cash and half stock, subject to customary adjustments. […] In year 1 and 2 after closing the transaction will be dilutive to Adobe's non-GAAP EPS, and we expect it to be breakeven in year 3 and accretive at the end of year 3.
p. 6 · Read in context →
The hardest question: is a $20B deal reactive, and is Adobe's organic engine still alive? Narayen: seize the decade-defining bet.
Brad Zelnick (Deutsche Bank); Shantanu Narayen, Chairman & CEO: what do you say to the perspective that this $20 billion acquisition seems more reactive versus proactive? And perhaps more importantly, how do we get comfortable that Adobe's organic-innovation engine is alive and well for capturing the trends and opportunities that lie ahead in Creative? […] I understand that in these markets, in particular, acquisitions and maybe large ones are viewed with some skepticism We certainly believe, and I'll talk about it, that Figma will be a transformative deal for the customers and industries. And it dramatically increases our TAM. We can deliver great value to an increasing set of customers. But I also want to reassure all of you, and if you look at our results, this in no way changes our focus or our excitement on our current portfolio.
We're growing well, and we're demonstrating strength across all of our 3 cloud offerings, and we continue to execute against our current initiatives And so if you look at the multiple internal businesses that are achieving velocity, whether it's Adobe Experience Platform and the apps that are built natively on top of it, what's happening with 3D and Immersive, what's happening with Acrobat Forms, what's happening with Frame.io. This is additive.
And when opportunities like this present themselves, Brad, I think it's the great companies that look at it and say, are you going to focus on the here and now only? Or are you going to seize on the opportunity that really positions Adobe for the next few decades?
p. 9 · Read in context →
More calls
Q1 FY2026 Earnings Call — March 12, 2026 · 13 pages · The last call before the freemium reset: the FY26 opening quarter under the new customer-group reporting, CC Pro migration and agentic-interface framing — a baseline for what changed one quarter later. · Open →
Q3 FY2025 Earnings Call — September 11, 2025 · 13 pages · Mid-year evidence that the AI story was ramping: accelerating AI-influenced/AI-first ARR and enterprise GenStudio/AEP momentum heading into the Firefly and Foundry launches at MAX. · Open →
Q2 FY2025 Earnings Call — June 12, 2025 · 14 pages · The quarter Adobe began breaking out an AI-first 'book of business' target and defended the pace of AI monetization against a de-rated stock. · Open →
Q1 FY2025 Earnings Call — March 12, 2025 · 14 pages · The first quarter reported under the new 'ending ARR book of business' methodology, with the standalone Firefly app and video generation moving from beta to market. · Open →
Q3 FY2024 Earnings Call — September 12, 2024 · 13 pages · A tight, two-analyst Q&A centered on AI Assistant adoption and Firefly Services — and the CEO's recurring 'AI expands our TAM' argument as the stock stayed under pressure. · Open →
Q2 FY2024 Earnings Call — June 13, 2024 · 14 pages · A beat that briefly rallied the stock: net-new Digital Media ARR reaccelerated and management pushed back on the AI-disruption narrative amid the Firefly terms-of-use controversy. · Open →
Q1 FY2023 Earnings Call — March 15, 2023 · 17 pages · The pre-Firefly baseline: strong Creative and Document Cloud results with the Figma deal still pending regulatory review, just before Adobe unveiled its generative-AI models. · Open →
Q2 FY2022 Earnings Call — June 16, 2022 · 18 pages · The quarter before the Figma bombshell — a clean read on Adobe's pre-acquisition, pre-GenAI growth model and how it framed macro and pricing at the time. · Open →
Adobe Inc.'s annual reports contain management's most considered account of the business. These are the sections, passages and visual pages worth opening in the originals preserved in Sources.
Adobe Inc. — FY2025 Annual Report (Form 10-K) — FY2025 (year ended November 28, 2025)
Latest 10-K; recasts the whole business around AI and pre-announces the FY2026 collapse to a single reportable segment. · Open the full document →
Item 1. Business — p. 4 · Read the full section →
Management's own framing of the mission, the AI-era pivot, and a competitive field now including AI- and cloud-native entrants.
Mission and the AI-era strategy of commercially-safe first-party plus partner models.
Adobe’s mission is to empower everyone to create. We build innovative platforms and tools that unleash creativity, productivity and personalized customer experiences. […] In the artificial intelligence (“AI”) era, we are harnessing the power of AI across our solutions by bringing together our commercially safe first-party and leading partner AI models best suited for the job; deploying conversational and agentic capabilities across offerings; ensuring ubiquity on all surfaces; delivering trusted and secure solutions
p. 4 · Read in context →
How Adobe describes its competitive environment — including new AI or cloud-native entrants.
We participate in a highly competitive and rapidly evolving environment where our competitors include companies of various sizes and both public and private companies, including large, global companies and smaller companies with more specialized focuses, new entrants, and AI or cloud-native companies. […] The markets for our solutions are characterized by rapid technological innovation, new industry standards, evolving distribution and sales models, limited barriers to entry, short product lifecycles, customer price sensitivity, global economic conditions and the frequent entry of new solutions or competitors.
p. 8 · Read in context →
Item 1. Business — Segments — p. 18 · Read the full section →
The structural break: three segments in FY2025, consolidated into one reportable segment effective Q1 FY2026.
Three FY2025 segments — and the coming single-segment reorganization.
In fiscal 2025, our business consisted of three reportable segments: Digital Media, Digital Experience and Publishing and Advertising. […] Effective in the first quarter of fiscal 2026, we will combine our prior segments—Digital Media, Digital Experience and Publishing and Advertising—into a single operating and reportable segment due to changes in how management intends to evaluate results, allocate resources and execute the strategic opportunities outlined above.
p. 18 · Read in context →
Item 1A. Risk Factors — p. 28 · Read the full section →
The two risks specific to Adobe's moment: keeping pace with AI, and the liability of building and shipping AI itself.
Item 7. MD&A — Results of Operations — p. 56 · Read the full section →
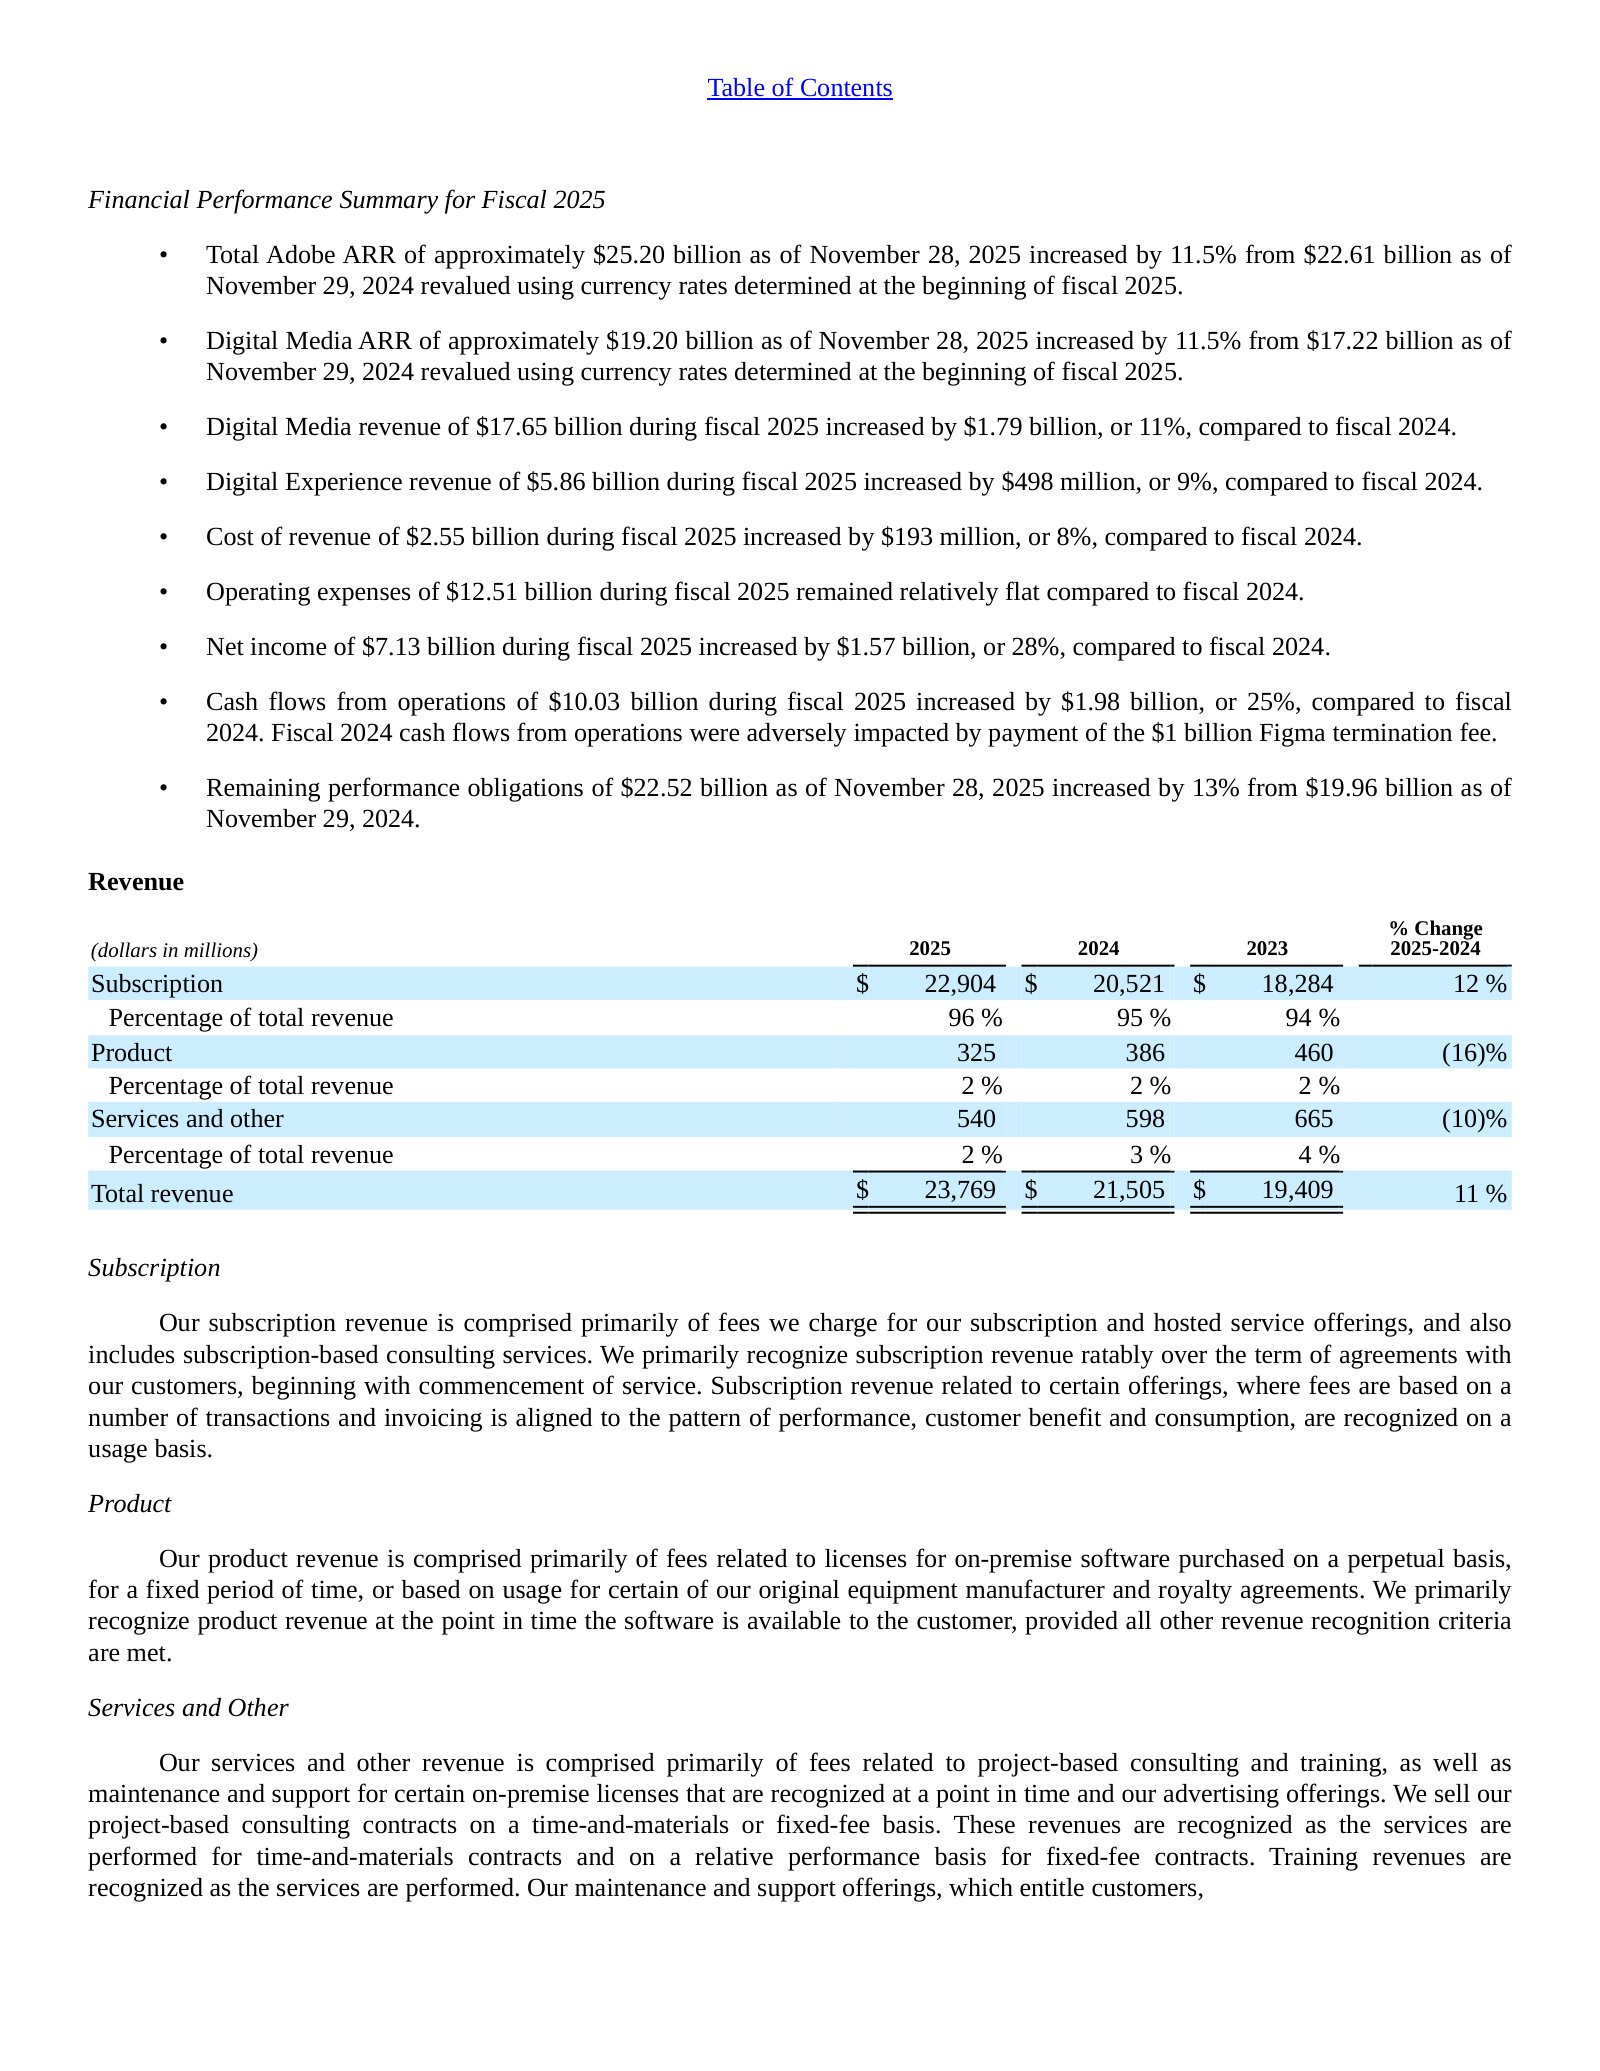
Management explains fiscal 2025: subscription-led growth across both major offerings, with the revenue mix now ~96% subscription.
What drove fiscal 2025 — AI-powered differentiation feeding software-based subscription growth.
For our fiscal 2025, we experienced strong demand across our Digital Media and Digital Experience offerings, driven by transformative and customer-focused product innovation. As we execute on our long-term growth initiatives, with emphasis on delivering value through AI-powered and highly differentiated solutions to meet the needs of our diverse and expanding customer base, we have continued to experience growth in software-based subscription revenue across our portfolio of offerings.
p. 56 · Read in context →
Item 7. MD&A — Segment Information — p. 61 · Read the full section →
The segment revenue table and what management credits for the growth — Creative Cloud Pro, Acrobat, and GenStudio.
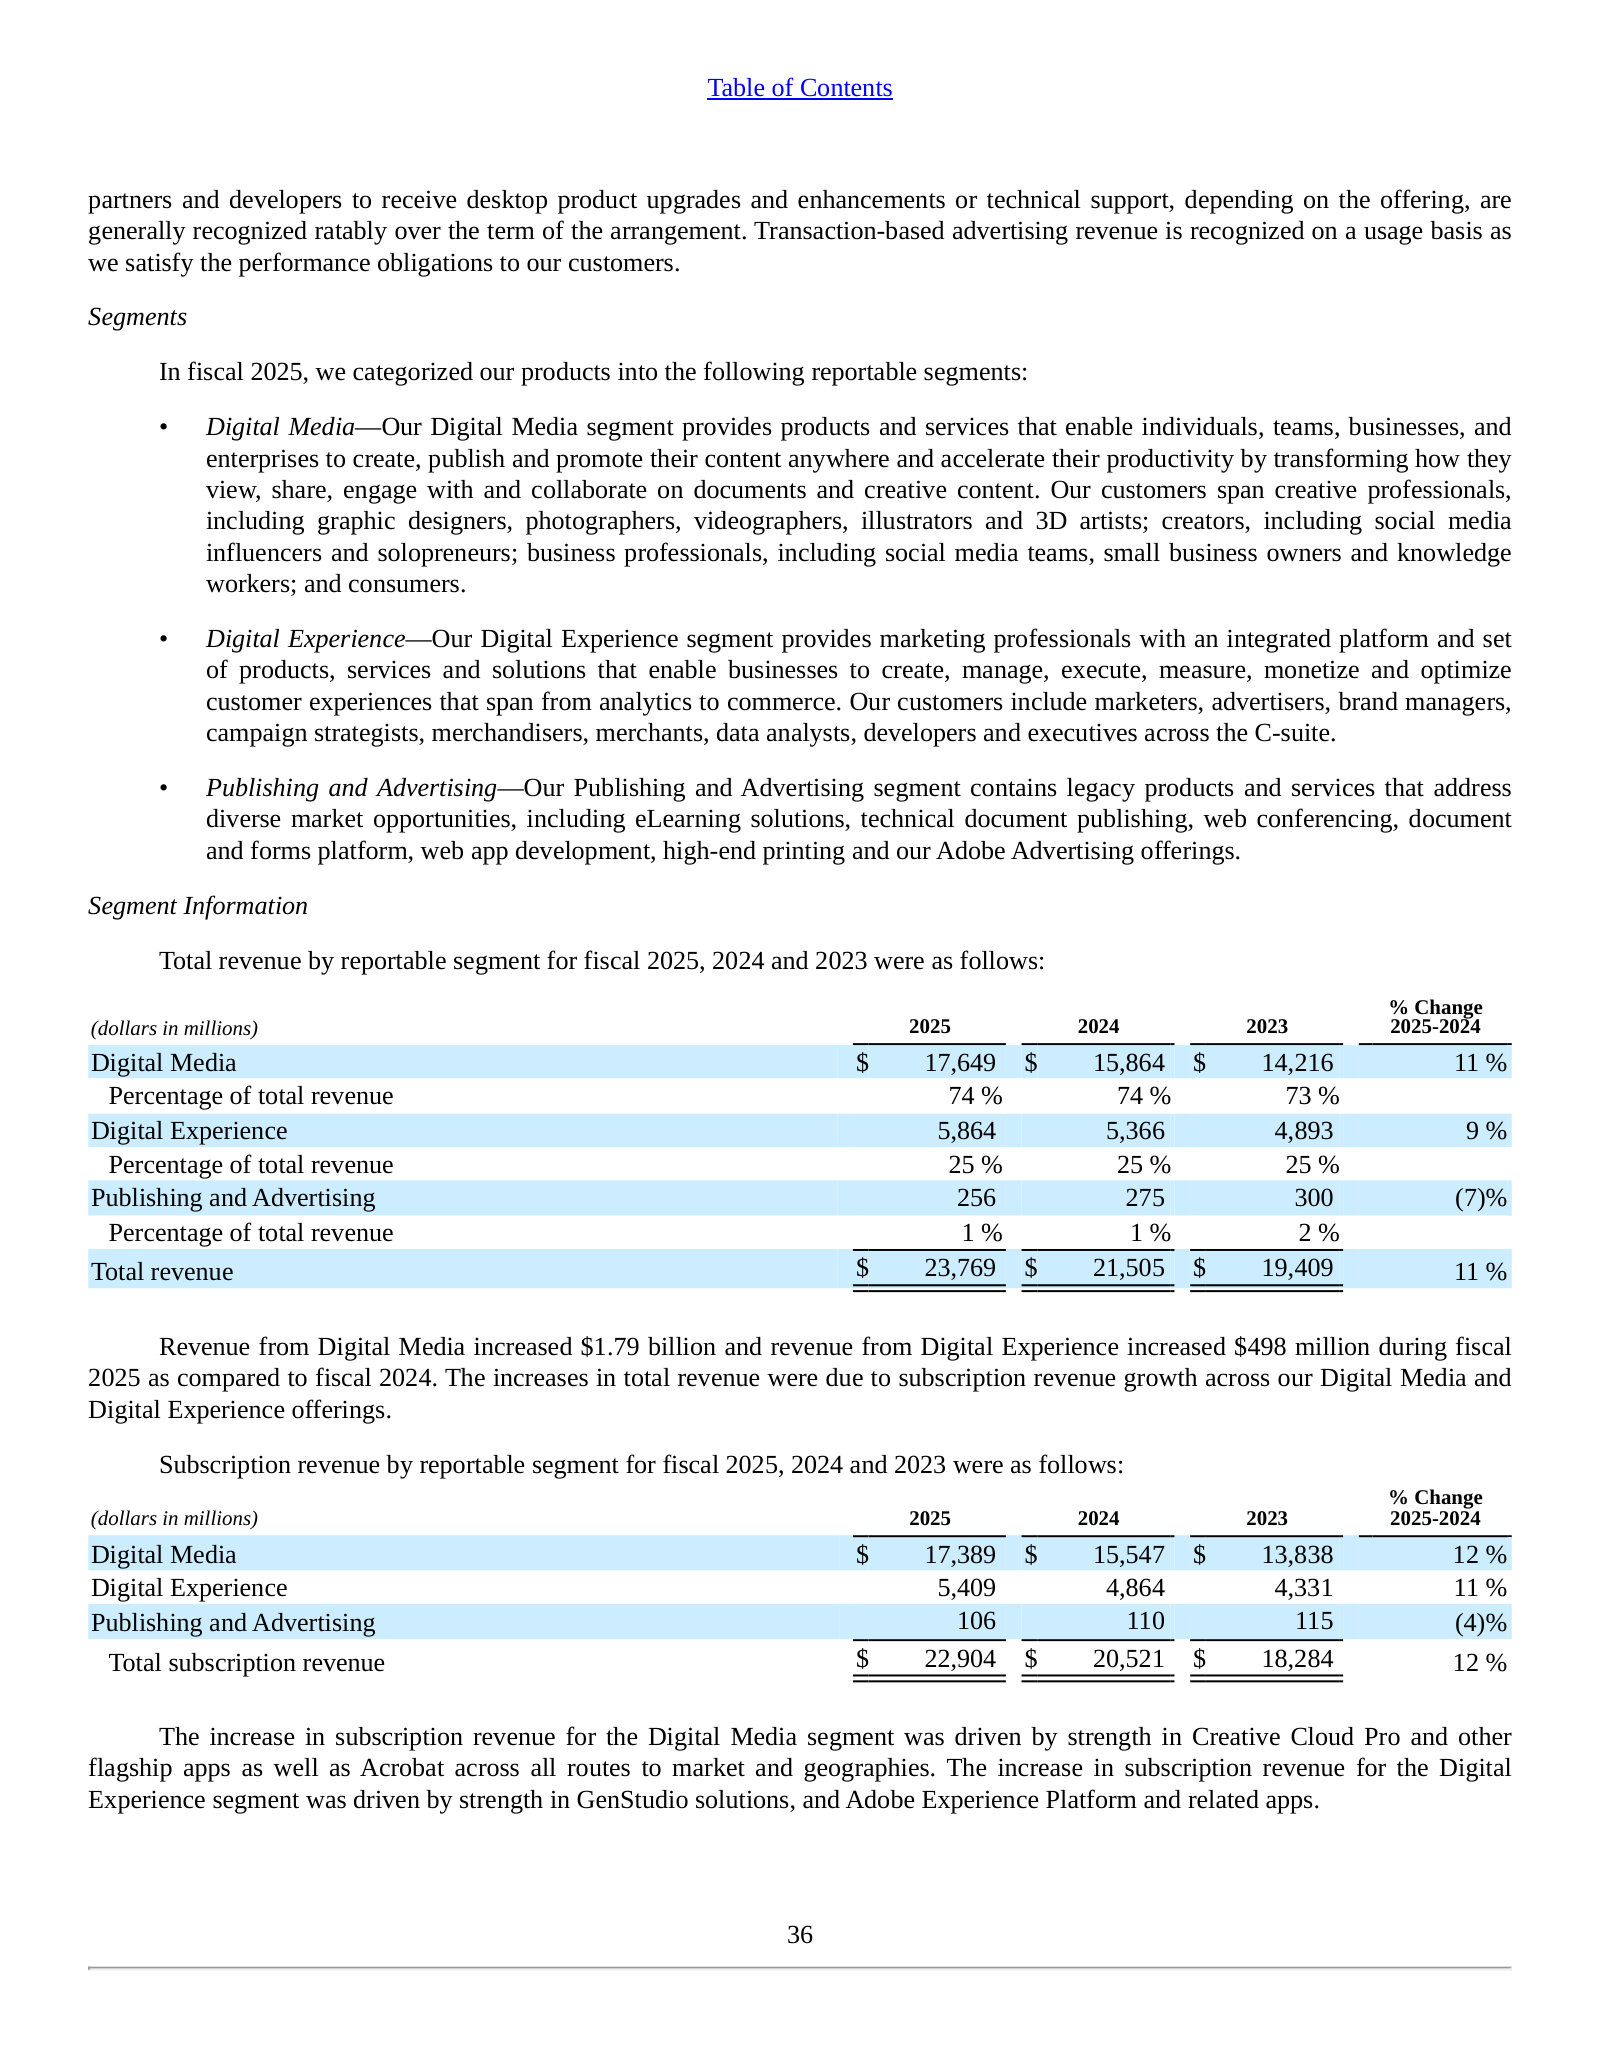
Named growth drivers for Digital Media subscription revenue.
The increase in subscription revenue for the Digital Media segment was driven by strength in Creative Cloud Pro and other flagship apps as well as Acrobat across all routes to market and geographies.
p. 61 · Read in context →
Note 1. Significant Accounting Policies — Revenue Recognition — p. 86 · Read the full section →
The accounting policy that defines the SaaS model: subscription and hosted revenue recognized ratably over the service term.
How Adobe recognizes hosted/subscription revenue — ratably over the contractual term.
Fully hosted subscription services (“SaaS”) allow customers to access hosted software during the contractual term without taking possession of the software. […] We recognize revenue ratably over the contractual service term, which typically ranges from 1 to 36 months, for hosted services that are priced based on a committed number of transactions where the delivery and consumption of the benefit of the services occur evenly over time, beginning on the date the services associated with the committed transactions are first made available to the customer and continuing through the end of the contractual service term.
p. 86 · Read in context →
More annual reports
Adobe Inc. — FY2024 Annual Report (Form 10-K) — FY2024 (year ended November 29, 2024) · 157 pages · Last full year on the classic three-segment reporting; Firefly ramping and the terminated Figma deal ($1.0B fee) behind it. · Open →
Adobe Inc. — FY2023 Annual Report (Form 10-K) — FY2023 (year ended December 1, 2023) · 157 pages · First 10-K to introduce Firefly generative AI, filed as the $20B Figma acquisition was being abandoned. · Open →
Adobe Inc. — FY2022 Annual Report (Form 10-K) — FY2022 (year ended December 2, 2022) · 164 pages · Announces the (later terminated) Figma acquisition agreement — a pre-generative-AI snapshot of the strategy. · Open →
Adobe Inc. — FY2021 Annual Report (Form 10-K) — FY2021 (year ended December 3, 2021) · 163 pages · Pre-Firefly, pre-Figma baseline of the Digital Media / Digital Experience subscription model. · Open →
Competitors describe Adobe Inc.'s market in their own filings and calls. These verified passages and visual pages show where their strategies meet, using source documents preserved in Sources.
Figma (FIG)
The most direct competitor to Adobe's Creative Cloud design tools. Figma's collaborative interface- and product-design platform overlaps Adobe XD, Photoshop and Illustrator in UI/UX work and increasingly in creative-for-marketing — the overlap regulators judged so close that Adobe's ~$20 billion acquisition of Figma was abandoned in 2023. Figma's transcripts avoid naming Adobe; the by-name material sits in the merger disclosure.
Figma's own 10-K records the abandoned Adobe merger — Adobe agreed to acquire Figma in September 2022 and the two terminated in December 2023 citing no clear path to regulatory approval — the clearest evidence antitrust regulators viewed the two as head-on competitors.
On September 15, 2022, we entered into an Agreement and Plan of Merger (the "Merger Agreement") with Adobe, Inc. ("Adobe") and certain of Adobe’s wholly-owned subsidiaries. On December 17, 2023, we mutually agreed with Adobe to terminate the Merger Agreement based on the joint assessment that there was no clear path to obtain the required regulatory approvals for the transaction to close
p. 142 · Read in context →
CEO Dylan Field stakes out the 'design layer above code' — including creative design for marketing and advertising — as the 'battleground for how software gets built,' the same creative and experience territory Adobe occupies.
Dylan Field, Co-Founder and CEO: As code becomes more commoditized and easier to write, design is clearly the layer above code and visual thinkers outnumber those comfortable in a terminal or an IDE. We expect this space to continue to heat up and be the battleground for how software gets built. Tools around visual communication and creative design for marketing and advertising will be essential for breaking through the noise.
p. 7 · Read in context →
Figma quantifies adoption of its AI app-builder Figma Make — 70% quarter-over-quarter growth in weekly active users, use by over half of its >$100k-ARR customers, and nearly 60% of 2025 Make files created by non-designers (developers, PMs, marketers) — showing Figma reaching beyond designers into content creation.
Dylan Field, Co-Founder and CEO: Weekly active users of Figma Make grew over 70% quarter-over-quarter. And, as of Q4, over 50% of paid customers spending more than $100,000 in ARR were building in Figma Make on a weekly basis. […] of all Figma Make files created in 2025, nearly 60% were created by non-designers. We’re talking developers, PMs, marketers, and others inside the company
p. 2 · Read in context →
Docusign (DOCU)
The direct competitor to Adobe's Document Cloud e-signature product, Acrobat Sign. Docusign's FY2026 10-K names Adobe as its 'primary global competitor for eSignature' — the tab's premise realised in the peer's own words — and it is expanding from pure e-signature into 'intelligent agreement management,' a broader document-workflow ambition that overlaps Adobe's Document Cloud.
Docusign's FY2026 10-K names Adobe (Acrobat Sign) as its primary global e-signature competitor, alongside broader software companies embedding basic e-signature and contract-lifecycle-management vendors.
Our primary global competitor for eSignature is currently Adobe, which offers an electronic signature solution known as Adobe Acrobat Sign. We also face competition from other global software companies that have or may elect to include basic electronic signature capability in their products and from various vendors that focus on specific industries, geographies, or product areas such as contract lifecycle management and advanced contract analytics.
p. 18 · Read in context →
Docusign sizes the agreement-management opportunity at a $2 trillion global market it has begun addressing for tens of thousands of customers — the document-workflow ambition, beyond pure e-signature, that overlaps Adobe's Document Cloud.
Allan Thygesen, Chief Executive Officer: Agreement management is a $2 trillion global market problem, and over the past 18 months, we’ve helped tens of thousands of customers begin to solve it.
p. 2 · Read in context →
Asked directly about the competitive landscape, CEO Allan Thygesen reports little change in the e-signature market — stable share, Docusign perhaps performing slightly better — a level-headed read on the mature category where Adobe is its named rival.
Allan Thygesen, Chief Executive Officer (responding to Patrick Walravens, Citizens JMP): In our legacy markets, I see very little change in the competitive dynamics. The market share and our competitors have been stable, and we may actually be performing slightly better. The CLM space remains quite competitive, with several players in a small category, but we are managing to hold our own despite the competition. As we redefine and enhance our company vision, we are setting the pace. However, as we broaden our ambitions, we are encountering not only existing competitors but also other potential challengers. Overall, we are becoming a thought leader in the agreement space. Right now, I believe our focus should be on execution rather than competition, especially in the more established e-sign category.
p. 13 · Read in context →
Salesforce (CRM)
The principal competitor to Adobe's Digital Experience segment. Salesforce's Marketing Cloud, Commerce Cloud and — most pointedly — its Data Cloud / Data 360 customer-data platform contest the same marketer buyer Adobe serves with Experience Cloud, Journey Optimizer and Real-Time CDP. Salesforce does not name Adobe; the overlap is drawn from its own product and data-platform disclosures.
Salesforce describes its Marketing offering as a 'complete marketing platform' for lifecycle personalization built on unified customer profiles — the segmentation, journeys and AI-driven personalization that collide with Adobe Campaign, Journey Optimizer and Experience Platform.
Our Marketing offering is a complete marketing platform designed to help customers personalize engagement across the customer lifecycle. […] With operational customer profiles, marketers and AI agents can easily take action on structured and unstructured data to build segments, calculate insights, analyze performance, and power AI recommendations, decisioning, and automations.
p. 8 · Read in context →
CEO Marc Benioff frames the customer-data business as Salesforce's most strategic, citing a ~$7 billion Data Cloud with 140% year-over-year customer growth and over half the Fortune 500 onboard — the CDP layer that directly contests Adobe's Real-Time CDP.
Marc Benioff, Chair and Chief Executive Officer: I think the data business is probably the most strategic and most important business for Salesforce going forward. And already, it’s a $7 billion business, and data cloud is having a great year. It had a 140% year over year growth in customers and 326% growth in rows accessed by zero copy integration. […] But over half of the Fortune 500 are already on Data Cloud, but it’s really just the very, very beginning.
p. 3 · Read in context →
Microsoft (MSFT)
A broad platform competitor colliding with Adobe on generative-AI content creation. Microsoft now ships its own first-party image-generation model (MAI Image Two) inside Bing and PowerPoint and Copilot 'agent mode' that produces finished creative deliverables — encroaching on Adobe Firefly and Creative Cloud. Only the content-creation lines are used here; Azure, gaming and LinkedIn are excluded. Notably, Adobe appears in these calls as a Microsoft customer and ISV partner, not a named rival.
Microsoft touts MAI Image Two as 'one of the top image generation models in the world,' already generating images in Bing and PowerPoint and sold to creative customers like Shutterstock and WPP — a first-party challenge to Adobe Firefly and Adobe Stock.
Satya Nadella, Chairman and Chief Executive Officer: We introduced MAI Transcribe One, a state-of-the-art speech-to-text model, and MAI Image Two, one of the top image generation models in the world. These models are already powering first-party scenarios like image generation in Bing and PowerPoint […] We also brought MAI models to commercial customers like Shutterstock and WPP for the first time through Foundry.
p. 2 · Read in context →
Nadella bundles Microsoft's first-party text/voice/image models with Copilot 'Agent Mode' that turns prompts into export-quality PowerPoint and Word — and names Adobe among the ISVs building agents on Copilot, casting Microsoft as the platform beneath Adobe.
Satya Nadella, Chairman and Chief Executive Officer: When it comes to our first-party models, we are excited by the performance of our new MAI models for text, voice and image generation, which debuted among the top in the industry leader boards. […] This quarter, we also introduced Agent Mode, which turns single prompts into export-quality Word documents, Excel spreadsheets, PowerPoint presentations and then iterates to deliver the final product much like agent mode in coding tools today. […] We are seeing a growing Copilot agent ecosystem with top ISVs like Adobe, Asana, Jira, LexisNexis, SAP, ServiceNow, Snowflake and Workday, all building their own agents that connect to Copilot.
p. 2 · Read in context →
Microsoft reports Copilot as its fastest-adopted Microsoft 365 suite and names Adobe among customers buying over 25,000 Copilot seats in the quarter — a reminder that Adobe is a Microsoft customer even as Microsoft builds competing creative-AI tools.
Satya Nadella, Chairman and Chief Executive Officer: Customers continue to adopt Copilot at a faster rate than any other new Microsoft 365 suite, with strong usage intensity as shown by our week-over-week retention. And we saw the largest quarter of seat additions since launch with a record number of customers returning to buy more seats. […] And Adobe, KPMG, Pfizer, and Wells Fargo all purchased over 25,000 seats this quarter.
p. 2 · Read in context →
Autodesk (ADSK)
A design-software peer whose overlap with Adobe is narrow but real, concentrated in Media & Entertainment — Maya, 3ds Max and Flame for film, VFX and games sit alongside Adobe's video and 3D/Substance tools — plus the shared subscription model and generative-AI content push. Autodesk's core AEC/CAD business does not overlap Adobe and is excluded. Autodesk names Adobe in its 10-K competitor list.
Autodesk's FY2026 10-K lists Adobe first among its primary global competitors and, in the same section, flags AI as a force that could reshape its markets — the explicit by-name acknowledgment of the rivalry.
Our primary global competitors include Adobe Systems Incorporated, Bentley Systems, Inc., Dassault Systèmes S.A. and its subsidiary Dassault Systèmes SolidWorks Corp., Intergraph Corporation, a wholly owned subsidiary of Hexagon AB, MSC Software Corporation, Nemetschek AG, Oracle Corporation, Procore Technologies, Inc., PTC Inc., 3D Systems Corporation, Siemens PLM, and Trimble Navigation Limited, among others. […] Disruptive technologies such as machine learning and other AI technologies may significantly alter the market for our products in unpredictable ways and reduce customer demand.
p. 17 · Read in context →
Autodesk describes its Media & Entertainment Collection as 'end-to-end creative tools for entertainment creation' — Maya and 3ds Max for film, VFX and games — the creative-media territory adjacent to Adobe's video and 3D offerings.
Maya software provides 3D modeling, animation, effects, rendering, and compositing solutions that enable film and video artists, game developers, and design visualization professionals to digitally create engaging, lifelike images, realistic animations and simulations, extraordinary visual effects, and full-length animated feature films. […] The M&E Collection provides end-to-end creative tools for entertainment creation. This collection enables animators, modelers, and visual effects artists to access the tools they need, including Maya and 3ds Max, to create compelling effects, 3D characters, and digital worlds.
p. 8 · Read in context →
Oracle (ORCL)
A marketing/customer-experience applications competitor to Adobe's Digital Experience segment, though a thin one: Oracle's story is dominated by database and OCI cloud infrastructure, and its named applications rival is Salesforce, not Adobe. Its CX applications — including a new website generator and campaign tooling — are the piece that overlaps Adobe Experience Cloud. Database, OCI and hardware are excluded.
Oracle says it has built three new CX applications — including a website generator and lead/campaign tooling ('email opens') — the content-management and marketing-automation surface Adobe Experience Cloud sells, though Oracle frames the rivalry against Salesforce rather than Adobe.
Mike Sicilia, Chief Executive Officer: Embracing AI with small engineering teams, we have just built three brand new CX applications: lead generation and qualification, sales orchestration and automated selling, and our new website generator. […] We have built these new CX products to help our customers sell, not simply to administer a forecast or generate email opens. These are three products that Salesforce does not have.
p. 2 · Read in context →
Oracle's FY2026 10-K lists Adobe among the companies its cloud and software offerings 'compete directly with' — a boilerplate, conglomerate-wide naming rather than a CX-specific one, but Adobe named in Oracle's own filing.
Our enterprise cloud, software and hardware offerings compete directly with certain offerings from some of the largest and most competitive companies in the world, including Adobe Systems Incorporated, Alphabet Inc., Amazon.com, Inc., Cisco Systems, Inc., Intel Corporation, International Business Machines Corporation, Microsoft Corporation, Salesforce, Inc. and SAP SE
p. 18 · Read in context →
More peer documents
Q2_FY2025 — 11 pages · Dylan Field on the 'vibe coding / vibe designing' AI-prototyping wave and how Figma Make's design-context interoperability differentiates it — color on the emerging AI-creative competitive front. · Open →
DOCU_annual_report_FY2025 — 158 pages · Prior-year 10-K also names Adobe Acrobat Sign as the primary e-signature competitor and adds the 'Intelligent Agreement Management is a new software category without incumbent competitors' positioning — a two-year read on the by-name rivalry. · Open →
CRM_annual_report_FY2026 — 144 pages · Latest-year restatement of the Marketing/Commerce definitions plus 'Agentforce for Marketing' — briefs, content and journeys on unified 360-degree profiles — the freshest language on the Experience-Cloud overlap. · Open →
Q3_FY2026 — 15 pages · Benioff quantifies Data 360 (renamed Data Cloud) at 32 trillion records ingested and frames a ~$10 billion data layer (Data 360 + MuleSoft + Informatica) — a bigger, later sizing of the CDP business contesting Adobe Real-Time CDP. · Open →
MSFT_annual_report_FY2025 — 137 pages · Productivity & Business Processes segment and M365 Consumer 'productivity and creativity' framing — the 10-K context for Microsoft's creative-AI push, though generic and naming Apple/Google/Slack/Zoom rather than Adobe as rivals. · Open →
Q1_FY2026 — 16 pages · CEO Andrew Anagnost on Flow Studio (formerly Wonder Studio) — a 'highly disruptive direct-to-special-effects' generative video/VFX tool — the clearest Autodesk collision with Adobe Firefly/video AI in creative media. · Open →
Q2_FY2026 — 10 pages · Fusion CX growth (+12%) inside a ~$6 billion cloud-applications run-rate and Oracle's 'only complete application suites' positioning — sizes the small CX slice that overlaps Adobe against ERP/HCM/SCM. · Open →
Q4_FY2026 — 14 pages · CEO on IAM's competitive advantages (1,100+ integrations, data moat) and the ARR mix ($3.3 billion ARR, IAM 11%) — the platform-differentiation and scale context behind the e-signature rivalry with Adobe. · Open →
Source: S&P Capital IQ consensus via Xpressfeed · Generated 2026-07-18.
Street snapshot
The USD price target averages $272 (median $250) but spans a wide $190 to $380 across 33 estimates.
Currency: USD · Scale: money in millions, absolute (per share) · Analyst counts shown explicitly; recommendation respondents: 39.
| Street view | Reading | Analysts |
|---|---|---|
| Recommendation mix | Buy 9, Outperform 2, Hold 24, Underperform 1, Sell 3 | 39 |
| Consensus score | 2.67 | 39 |
| Target price | mean 272.5; high 380.0; low 190.0 | 33 |
Forward table
Currency: USD · Scale: money in millions, absolute (per share) · Analyst count is the estimate count for each period and metric.
| Period | Metric | Mean | YoY | Analysts | Low / high |
|---|---|---|---|---|---|
| FY0E | Revenue | 26,518 | 11.6% | 30 | 25,810 / 26,737 |
| FY0E | EBITDA | 12,668 | 7.3% | 8 | 12,330 / 12,904 |
| FY0E | EBIT | 11,951 | 9.2% | — | — / — |
| FY0E | Net income (GAAP) | 7,212 | 1.2% | 17 | 7,013 / 7,484 |
| FY0E | Net income (normalized) | 9,671 | 8.5% | — | — / — |
| FY0E | EPS (GAAP) | 18.10 | 8.4% | 16 | 17.55 / 18.78 |
| FY0E | EPS (normalized) | 24.42 | 16.6% | 31 | 24.25 / 24.99 |
| FY0E | Free cash flow | 10,371 | 11.3% | — | — / — |
| FY0E | Dividend per share | 0.00 | — | — | — / — |
| FY0E | Gross margin | 89.9% | -0.2% | — | — / — |
| FY0E | Capital expenditure | -218.1 | 1.3% | — | — / — |
| FY0E | Net debt | -768.9 | -40.1% | — | — / — |
| FY0E | ROE | 74.6% | 23.1% | — | — / — |
| FY0E | Cash from operations | 10,497 | 10.7% | — | — / — |
| FY+1E | Revenue | 28,891 | 8.9% | 30 | 28,350 / 29,812 |
| FY+1E | EBITDA | 13,651 | 7.8% | 8 | 13,090 / 14,252 |
| FY+1E | EBIT | 12,936 | 8.2% | — | — / — |
| FY+1E | Net income (GAAP) | 8,148 | 13.0% | 17 | 7,474 / 8,812 |
| FY+1E | Net income (normalized) | 10,456 | 8.1% | — | — / — |
| FY+1E | EPS (GAAP) | 21.35 | 18.0% | 16 | 19.99 / 23.61 |
| FY+1E | EPS (normalized) | 27.53 | 12.7% | 32 | 25.66 / 29.15 |
| FY+1E | Free cash flow | 11,240 | 8.4% | — | — / — |
| FY+1E | Dividend per share | 0.00 | — | — | — / — |
| FY+1E | Gross margin | 89.5% | -0.4% | — | — / — |
| FY+1E | Capital expenditure | -268.5 | 23.1% | — | — / — |
| FY+1E | Net debt | -4,662 | 506.4% | — | — / — |
| FY+1E | Cash from operations | 11,516 | 9.7% | — | — / — |
| FY+1E | ROE | 71.5% | -4.3% | — | — / — |
| FY+2E | Revenue | 31,384 | 8.6% | 15 | 30,587 / 33,344 |
| FY+2E | EBITDA | 14,575 | 6.8% | 5 | 13,934 / 14,997 |
| FY+2E | EBIT | 14,105 | 9.0% | — | — / — |
| FY+2E | Net income (GAAP) | 9,124 | 12.0% | 8 | 8,638 / 9,995 |
| FY+2E | Net income (normalized) | 11,366 | 8.7% | — | — / — |
| FY+2E | EPS (GAAP) | 24.72 | 15.8% | 8 | 22.97 / 28.50 |
| FY+2E | EPS (normalized) | 31.45 | 14.3% | 15 | 29.35 / 34.94 |
| FY+2E | Free cash flow | 12,168 | 8.3% | — | — / — |
| FY+2E | Dividend per share | 0.00 | — | — | — / — |
| FY+2E | Gross margin | 89.3% | -0.1% | — | — / — |
| FY+2E | Capital expenditure | -327.0 | 21.8% | — | — / — |
| FY+2E | Net debt | -3,277 | -29.7% | — | — / — |
| FY+2E | ROE | 67.4% | -5.7% | — | — / — |
| FY+2E | Cash from operations | 12,758 | 10.8% | — | — / — |
| Q3 FY2026 | Revenue | 6,695 | 11.8% | 27 | 6,597 / 6,764 |
| Q3 FY2026 | EBITDA | 3,140 | 5.3% | 8 | 3,005 / 3,248 |
| Q3 FY2026 | EBIT | 2,953 | 9.6% | — | — / — |
| Q3 FY2026 | Net income (GAAP) | 1,769 | -0.2% | 14 | 1,678 / 1,894 |
| Q3 FY2026 | Net income (normalized) | 2,403 | 9.0% | — | — / — |
| Q3 FY2026 | EPS (GAAP) | 4.48 | 7.2% | 14 | 4.25 / 4.80 |
| Q3 FY2026 | EPS (normalized) | 6.08 | 14.5% | 28 | 5.82 / 6.35 |
| Q3 FY2026 | Free cash flow | 2,184 | 4.9% | — | — / — |
| Q3 FY2026 | Dividend per share | 0.00 | — | — | — / — |
| Q3 FY2026 | Gross margin | 89.9% | -0.3% | — | — / — |
| Q3 FY2026 | Capital expenditure | -61.00 | -0.6% | — | — / — |
| Q3 FY2026 | ROE | 83.6% | 16.1% | — | — / — |
| Q3 FY2026 | Cash from operations | 2,184 | 3.9% | — | — / — |
| Q4 FY2026 | Revenue | 6,832 | 10.3% | 26 | 6,510 / 6,957 |
| Q4 FY2026 | EBITDA | 3,192 | 6.1% | 8 | 2,978 / 3,310 |
| Q4 FY2026 | EBIT | 3,024 | 8.7% | — | — / — |
| Q4 FY2026 | Net income (GAAP) | 1,849 | -0.4% | 14 | 1,734 / 1,988 |
| Q4 FY2026 | Net income (normalized) | 2,459 | 8.7% | — | — / — |
| Q4 FY2026 | EPS (GAAP) | 4.75 | 6.7% | 14 | 4.45 / 5.12 |
| Q4 FY2026 | EPS (normalized) | 6.32 | 14.9% | 28 | 5.88 / 6.62 |
| Q4 FY2026 | Free cash flow | 3,193 | 21.6% | — | — / — |
| Q4 FY2026 | Dividend per share | 0.00 | — | — | — / — |
| Q4 FY2026 | Gross margin | 89.7% | -0.4% | — | — / — |
| Q4 FY2026 | Capital expenditure | -55.56 | -11.7% | — | — / — |
| Q4 FY2026 | Cash from operations | 3,187 | 17.1% | — | — / — |
| Q4 FY2026 | ROE | 82.7% | 7.9% | — | — / — |
| Q1 FY2027 | Revenue | 6,988 | 9.2% | 22 | 6,896 / 7,163 |
| Q1 FY2027 | EBITDA | 3,395 | 5.8% | 6 | 3,159 / 3,554 |
| Q1 FY2027 | EBIT | 3,212 | 8.9% | — | — / — |
| Q1 FY2027 | Net income (GAAP) | 2,029 | 7.4% | 12 | 1,893 / 2,229 |
| Q1 FY2027 | Net income (normalized) | 2,617 | 8.3% | — | — / — |
| Q1 FY2027 | EPS (GAAP) | 5.21 | 13.4% | 12 | 4.89 / 5.82 |
| Q1 FY2027 | EPS (normalized) | 6.73 | 11.1% | 24 | 6.39 / 7.08 |
| Q1 FY2027 | Free cash flow | 2,938 | 27.9% | — | — / — |
| Q1 FY2027 | Dividend per share | 0.00 | — | — | — / — |
| Q1 FY2027 | Gross margin | 89.6% | -0.5% | — | — / — |
| Q1 FY2027 | Capital expenditure | -59.11 | 11.4% | — | — / — |
| Q1 FY2027 | Cash from operations | 3,061 | 28.4% | — | — / — |
| Q1 FY2027 | ROE | 91.4% | 11.2% | — | — / — |
| Q2 FY2027 | Revenue | 7,203 | 8.8% | 22 | 7,095 / 7,448 |
| Q2 FY2027 | EBITDA | 3,355 | 6.9% | 6 | 3,085 / 3,512 |
| Q2 FY2027 | EBIT | 3,198 | 11.4% | — | — / — |
| Q2 FY2027 | Net income (GAAP) | 2,020 | 18.0% | 12 | 1,892 / 2,121 |
| Q2 FY2027 | Net income (normalized) | 2,604 | 11.2% | — | — / — |
| Q2 FY2027 | EPS (GAAP) | 5.23 | 23.1% | 12 | 4.91 / 5.63 |
| Q2 FY2027 | EPS (normalized) | 6.80 | 14.1% | 24 | 6.49 / 7.11 |
| Q2 FY2027 | Free cash flow | 2,432 | 7.0% | — | — / — |
| Q2 FY2027 | Dividend per share | 0.00 | — | — | — / — |
| Q2 FY2027 | Gross margin | 89.4% | -0.5% | — | — / — |
| Q2 FY2027 | Capital expenditure | -64.64 | 16.5% | — | — / — |
| Q2 FY2027 | ROE | 86.0% | 2.1% | — | — / — |
| Q2 FY2027 | Cash from operations | 2,550 | 18.7% | — | — / — |
Estimate momentum
The upgrades have largely stalled in the last 30 days, where both revenue and EPS marks are essentially flat.
Currency: USD · Scale: money in millions, absolute (per share) · Point-in-time consensus; analyst count is shown where supplied.
| Period | Metric | Lookback | Then | Now | Direction / magnitude | Analysts |
|---|---|---|---|---|---|---|
| 2028 | Revenue | 30d | 31,437 | 31,384 | down 0.2% | — |
| 2028 | Revenue | 90d | 31,097 | 31,384 | up 0.9% | — |
| 2028 | Revenue | 180d | 30,628 | 31,384 | up 2.5% | — |
| 2027 | EPS (normalized) | 30d | 27.54 | 27.53 | down 0.0% | — |
| 2027 | EPS (normalized) | 90d | 26.31 | 27.53 | up 4.6% | — |
| 2027 | EPS (normalized) | 180d | 26.34 | 27.53 | up 4.5% | — |
| 2028 | EPS (normalized) | 30d | 31.54 | 31.45 | down 0.3% | — |
| 2028 | EPS (normalized) | 90d | 29.29 | 31.45 | up 7.4% | — |
| 2028 | EPS (normalized) | 180d | 28.78 | 31.45 | up 9.3% | — |
| 2027 | Revenue | 30d | 28,901 | 28,891 | down 0.0% | — |
| 2027 | Revenue | 90d | 28,421 | 28,891 | up 1.7% | — |
| 2027 | Revenue | 180d | 28,365 | 28,891 | up 1.9% | — |
Beat / miss record
Adobe has topped consensus on both revenue and normalized EPS in each of the last eight quarters. The EPS surprises have run the larger of the two, roughly +1.7% to +3.2%, while revenue beats have been narrower at about +0.6% to +2.6%.
Current sequences by metric: Revenue: 8 consecutive beats; EPS (normalized): 8 consecutive beats.
Currency: USD · Scale: money in millions, absolute (per share) · Consensus is captured before each actual first became effective; analyst count shown per observation.
| Quarter | Metric | Consensus as of | Actual | Surprise | Outcome | Analysts |
|---|---|---|---|---|---|---|
| Q2 FY2026 | Revenue | 6,451 | 6,618 | 2.6% | Beat | — |
| Q2 FY2026 | EPS (normalized) | 5.81 | 5.96 | 2.5% | Beat | — |
| Q1 FY2026 | Revenue | 6,277 | 6,398 | 1.9% | Beat | — |
| Q1 FY2026 | EPS (normalized) | 5.87 | 6.06 | 3.2% | Beat | — |
| Q4 FY2025 | Revenue | 6,111 | 6,194 | 1.4% | Beat | — |
| Q4 FY2025 | EPS (normalized) | 5.40 | 5.50 | 1.9% | Beat | — |
| Q3 FY2025 | Revenue | 5,909 | 5,988 | 1.3% | Beat | — |
| Q3 FY2025 | EPS (normalized) | 5.18 | 5.31 | 2.5% | Beat | — |
| Q2 FY2025 | Revenue | 5,805 | 5,873 | 1.2% | Beat | — |
| Q2 FY2025 | EPS (normalized) | 4.97 | 5.06 | 1.7% | Beat | — |
| Q1 FY2025 | Revenue | 5,662 | 5,714 | 0.9% | Beat | — |
| Q1 FY2025 | EPS (normalized) | 4.97 | 5.08 | 2.2% | Beat | — |
| Q4 FY2024 | Revenue | 5,541 | 5,606 | 1.2% | Beat | — |
| Q4 FY2024 | EPS (normalized) | 4.67 | 4.81 | 3.0% | Beat | — |
| Q3 FY2024 | Revenue | 5,373 | 5,408 | 0.6% | Beat | — |
| Q3 FY2024 | EPS (normalized) | 4.54 | 4.65 | 2.5% | Beat | — |
Where the street disagrees
Out-year earnings estimates widen as coverage thins — FY2028 normalized EPS spans $29.35 to $34.94 across 15 contributors and FY2029 rests on just one to two estimates — while EBITDA is covered by only a handful of analysts throughout.
Currency: USD · Scale: money in millions, absolute (per share) · Dispersion is high-low divided by absolute mean; analyst count shown per item.
| Period | Metric | Mean | Low | High | Spread / mean | Analysts |
|---|---|---|---|---|---|---|
| 2028 | EPS (GAAP) | 24.72 | 22.97 | 28.50 | 22.4% | 8 |
| Q1 FY2027 | EPS (GAAP) | 5.21 | 4.89 | 5.82 | 17.9% | 12 |
| 2028 | EPS (normalized) | 31.45 | 29.35 | 34.94 | 17.8% | 15 |
| 2027 | EPS (GAAP) | 21.35 | 19.99 | 23.61 | 17.0% | 16 |
| Q1 FY2027 | Net income (GAAP) | 2,029 | 1,893 | 2,229 | 16.6% | 12 |
Source: Visible Alpha consensus via S&P Xpressfeed · Consensus as of 2026-07-14 · generated 2026-07-18.
Model trust
FY-2025 is the last actual year, with FY-2026 through FY-2028 estimated.
Base currency: USD · VA scales normalized from Abs, M; item currencies and units retained · Coverage depth and vintage; broker count is the maximum represented.
| Brokers | Line items | Last revision |
|---|---|---|
| 24 | 403 | 2026-07-14 |
Operating KPIs
Coverage on these lines is thinner than the P&L, at roughly 5 to 17 brokers versus 20-plus on revenue, so the ARR path reads as indicative rather than firm.
Base currency: USD · VA scales normalized from Abs, M; item currencies and units retained · FY-1A / FY0E / FY+1E; broker count shown per KPI.
| Operating KPI | Source | FY-1A | FY0E | FY+1E | Brokers |
|---|---|---|---|---|---|
| Net cash provided by/(used for) investing activities | CD | -1,009,722.12bn Amount | -1,293,337.68bn Amount | -349,359.02bn Amount | 24 |
| Revenue | CD | 23,687,876.96bn Amount | 26,528,381.78bn Amount | 28,856,659.00bn Amount | 24 |
| Cash and cash equivalents at beginning of period | CD | 7,753,150.60bn Amount | 5,303,803.00bn Amount | 6,689,992.59bn Amount | 23 |
| Depreciation, amortization and accretion | CD | 801,010.09bn Amount | 763,302.23bn Amount | 791,349.74bn Amount | 23 |
| Net cash provided by/(used for) financing activities | CD | -10,055,915.33bn Amount | -7,532,670.42bn Amount | -7,932,879.96bn Amount | 23 |
| Net cash provided by/(used in) operating activities | CD | 9,497,310.22bn Amount | 10,622,862.03bn Amount | 11,633,324.71bn Amount | 23 |
| Purchases of property and equipment | CD | 261,614.71bn Amount | 237,194.62bn Amount | 280,852.61bn Amount | 23 |
| Cash and cash equivalents | CD | 5,605,524.63bn Amount | 7,054,628.28bn Amount | 11,564,463.98bn Amount | 22 |
| Debt | CD | 5,869,340.91bn Amount | 4,955,388.89bn Amount | 4,955,388.89bn Amount | 22 |
| Effect of foreign currency exchange rates on cash and cash equivalents | CD | 39611681.8% | 3165450.0% | 2012000.0% | 22 |
| Free cash flow | CD | 9,221,848.49bn Amount | 10,394,946.58bn Amount | 11,321,514.29bn Amount | 22 |
| Free cash flow/share($) | CD | 21.51 Amount | 26.02 Amount | 29.60 Amount | 22 |
P&L bridge
Base currency: USD · VA scales normalized from Abs, M; item currencies and units retained · Margins are derived against revenue; YoY compares adjacent fiscal columns; broker count shown per line.
| P&L line | FY-1A | FY0E | FY+1E | Brokers |
|---|---|---|---|---|
| Revenue | 23,687,876.96bn Amount | 26,528,381.78bn Amount (12.0% YoY) | 28,856,659.00bn Amount (8.8% YoY) | 24 |
| Gross Profit | 21,364,625.20bn Amount (90.2% margin) | 23,876,583.11bn Amount (90.0% margin; 11.8% YoY) | 25,875,978.38bn Amount (89.7% margin; 8.4% YoY) | 23 |
| Ebitda | 11,629,235.82bn Amount (49.1% margin) | 12,697,563.31bn Amount (47.9% margin; 9.2% YoY) | 13,742,242.51bn Amount (47.6% margin; 8.2% YoY) | 22 |
| Operating Income | 10,838,984.23bn Amount (45.8% margin) | 11,938,835.18bn Amount (45.0% margin; 10.1% YoY) | 12,946,103.95bn Amount (44.9% margin; 8.4% YoY) | 23 |
| Net Income | 8,838,925.96bn Amount (37.3% margin) | 9,734,217.31bn Amount (36.7% margin; 10.1% YoY) | 10,538,467.13bn Amount (36.5% margin; 8.3% YoY) | 22 |
| Eps | 20.60 Amount | 24.37 Amount (18.3% YoY) | 27.52 Amount (12.9% YoY) | 22 |
Consensus dispersion
The pattern points to margin and capital-return conversion, not revenue, as the open question.
Base currency: USD · VA scales normalized from Abs, M; item currencies and units retained · Top high-low spreads relative to absolute mean; requires at least 3 brokers.
| Line item | Period | Mean | Min | Q1 | Q3 | Max | Spread / mean | Brokers |
|---|---|---|---|---|---|---|---|---|
| Net cash provided by/(used for) investing activities | 4QFY-2025 | -51,265.84bn Amount | -238,250.00bn Amount | -75,000.00bn Amount | -60,950.00bn Amount | 531,449.83bn Amount | 1501.4% | 21 |
| Net cash provided by/(used for) investing activities | 4QFY-2026 | -80,729.42bn Amount | -491,219.18bn Amount | -68,254.79bn Amount | -50,375.82bn Amount | -15,737.86bn Amount | 589.0% | 18 |
| Effect of foreign currency exchange rates on cash and cash equivalents | FY-2026 | 3165450.0% | -12691000.0% | 4000000.0% | 4000000.0% | 4000000.0% | 527.3% | 20 |
| Net cash provided by/(used for) investing activities | FY-2028 | -523,452.91bn Amount | -2,879,527.00bn Amount | -345,770.87bn Amount | -232,185.55bn Amount | -137,571.58bn Amount | 523.8% | 13 |
| Net cash provided by/(used for) investing activities | FY-2027 | -349,359.02bn Amount | -1,720,233.00bn Amount | -327,088.84bn Amount | -225,021.40bn Amount | -112,568.67bn Amount | 460.2% | 20 |
| Net cash provided by/(used for) investing activities | 3QFY-2025 | -77,210.35bn Amount | -275,500.00bn Amount | -69,971.55bn Amount | -48,239.93bn Amount | -44,437.50bn Amount | 299.3% | 19 |
Quarterly path
These forward ARR lines rest on only 5 to 7 brokers, so the quarterly KPI path is less firmly held than revenue and EPS.
Base currency: USD · VA scales normalized from Abs, M; item currencies and units retained · Next four supplied quarters; final column is maximum broker coverage in the row.
| Quarter | Net cash provided by/(used for) investing activities | Revenue | Cash and cash equivalents at beginning of period | Depreciation, amortization and accretion | Net cash provided by/(used for) financing activities | Total revenue | EPS Diluted, Applicable to common stockholders($) | Broker coverage |
|---|---|---|---|---|---|---|---|---|
| 3QFY-2026 | -66,092.14bn Amount | 6,691,254.58bn Amount | 4,918,751.56bn Amount | 213,045.29bn Amount | -2,004,422.22bn Amount | 6,691,254.58bn Amount | 6.07 Amount | 20 |
| 4QFY-2026 | -80,729.42bn Amount | 6,818,360.30bn Amount | 5,392,311.53bn Amount | 211,150.53bn Amount | -2,011,874.54bn Amount | 6,818,360.30bn Amount | 6.28 Amount | 20 |
| 1QFY-2027 | -60,963.70bn Amount | 6,974,491.61bn Amount | 6,703,167.09bn Amount | 204,531.11bn Amount | -2,160,319.09bn Amount | 6,974,491.61bn Amount | 6.73 Amount | 20 |
| 2QFY-2027 | -66,071.80bn Amount | 7,191,656.44bn Amount | 7,908,579.19bn Amount | 205,898.11bn Amount | -2,000,718.42bn Amount | 7,191,656.44bn Amount | 6.78 Amount | 20 |
23 stale period values omitted; 0 line items fully removed.
Source: S&P Capital IQ transcripts via Xpressfeed · latest indexed call 2026-06-11 · generated 2026-07-18.
Latest call digest
Adobe Inc., Q2 2026 Earnings Call, Jun 11, 2026 · 2026-06-11T21:00:00
Q2 FY2026 — June 11, 2026. Adobe posted record revenue of $6.62B (+11% YoY constant currency) and non-GAAP EPS of $5.96, and raised full-year revenue and non-GAAP EPS targets (now including the Semrush acquisition, ~$480M of ARR). But the prepared remarks and the Q&A told two different stories. Management's message was strategic: with adobe.com traffic up 35–50% YoY and AI reshaping how users discover products, Adobe is pivoting hard to a freemium/MAU-first acquisition model — expanding free Firefly, Express and Acrobat onboarding, and deferring previously planned Creative Cloud line (price) optimizations. AI-first ARR crossed $500M (3x YoY) and Firefly ARR grew ~50% QoQ toward ~$300M. The cost: the total-Adobe ARR growth target was framed at 10.2% and management explicitly conceded the pivot lowers second-half ARR from individual subscribers. Overlaying this, CFO Dan Durn is departing (Steve Day named interim CFO) while the CEO search continues as Shantanu Narayen moves toward Board Chair. The Q&A was pointed and repetitive: analysts pressed on why now, the payback on the roughly half-billion-dollar ARR give-up, the durability of free-user LTV, and — from the other direction — whether Adobe should be pivoting even harder. Management leaned on early Firefly/Express traction and the Reader-era freemium playbook, but offered directional rather than precise payback math ("play out over 2027").
Participant coverage from the latest call.
| Group | Participants | Count |
|---|---|---|
| Management | Operator; Douglas Clark — Vice President of Investor Relations, Adobe Inc.; Shantanu Narayen — Chairman & CEO, Adobe Inc.; David Wadhwani — President of Creativity & Productivity Business, Adobe Inc.; Anil Chakravarthy — President of Customer Experience Orchestration Business, Adobe Inc.; Steven Day — Interim CFO and Senior VP of Finance, Technology, Security & Operations, Adobe Inc. | 6 |
| Analysts | Michael Turrin — Equity Analyst, Wells Fargo Securities, LLC, Research Division; Aleksandr Zukin — MD & Head of the Software Group, Wolfe Research, LLC; Matthew Swanson — Analyst, RBC Capital Markets, Research Division; Brad Zelnick — MD of Software Equity Research & Senior US Software Research Analyst, Deutsche Bank AG, Research Division; William Fitzsimmons — Senior Research Analyst, Piper Sandler & Co., Research Division; S. Kirk Materne — Senior MD & Fundamental Research Analyst, Evercore ISI Institutional Equities, Research Division; Brent Thill — MD & Tech Sector Equity Analyst, Jefferies LLC, Research Division; Saket Kalia — Senior Analyst, Barclays Bank PLC, Research Division | 8 |
Curated latest-call exchanges; one row per analyst topic.
| Analyst | Firm | Topic | What changed in Q&A |
|---|---|---|---|
| Michael Turrin | Wells Fargo Securities | CEO & CFO transition | Opened on managing continuity with both a CEO search and a CFO departure in motion, and the profile needed for the next chapter. Narayen stressed a seasoned finance bench and said Adobe 'won't miss a beat.' |
| Aleksandr Zukin | Wolfe Research | Freemium timing & ARR payback | Hardest exchange: challenged why freemium flipped from a second-half tailwind to a headwind, and asked the payback period/multiple on the ~$0.5B organic ARR give-up. Management pointed to early MAU/Firefly signals but framed payback qualitatively as playing out over 2027 rather than a specific figure. |
| S. Kirk Materne | Evercore ISI | Free-user LTV & stickiness | Asked how they get comfortable on long-term economics of free users. Wadhwani cited higher engagement and conversion for search-led free users versus direct-to-paid, but conceded it 'needs time to play out.' |
| Brent Thill | Jefferies | Pace of the pivot | Pushed from the opposite side — why not pivot harder and build a bigger moat, invoking the subscription transition. Narayen said Adobe is spending on models, marketing and product and 'will not be short-term focused,' but keeping discipline. |
| Brad Zelnick | Deutsche Bank | Co-opetition with AI platforms | On partnering versus competing with Google/OpenAI/Anthropic building their own design tools. Management framed cloud-spend partnerships and argued rivals are focused on code while Adobe is the 'company of one' on consumer creativity. |
| Matthew Swanson | RBC Capital Markets | Semrush / brand visibility | How Semrush fits the portfolio. Chakravarthy described marrying Semrush's outside-in query data with Adobe's content (AEM) for generative-engine-optimization brand visibility, to be unveiled at Cannes Lions. |
| William Fitzsimmons | Piper Sandler | Moats, M&A & buyback | On AI-era moats (20 years of data, governance/auditability) and appetite for tuck-in M&A alongside the new $25B authorization. Narayen said it is a good time for technology tuck-ins as many AI companies lack sustainable models. |
Theme tracker
Themes are curator-classified across supplied calls.
| Theme | Status | Quarters mentioned | Read-through |
|---|---|---|---|
| Firefly & generative-AI monetization | persisted | Q3 2023, Q4 2023, Q1 2024, Q2 2024, Q3 2024, Q4 2024, Q1 2025, Q2 2025, Q3 2025, Q4 2025, Q1 2026, Q2 2026 | Present on every call in the window. The framing evolved from image-generation volume and generative credits (2023–24) to a standalone Firefly app, credit packs and enterprise Firefly Services, with Firefly ARR approaching $300M by Q2 2026. |
| AI-first / AI-influenced ARR disclosure | emerged | Q1 2025, Q2 2025, Q3 2025, Q4 2025, Q1 2026, Q2 2026 | New disclosure begun in Q1 2025 (>$125M AI-first book of business), then repeatedly quantified — $250M target achieved early in Q3 2025, AI-influenced ARR past $5B, AI-first ARR >$500M by Q2 2026. Became the primary lens for the AI narrative. |
| Freemium / MAU-first acquisition pivot | emerged | Q4 2025, Q1 2026, Q2 2026 | Freemium existed for Acrobat/Express earlier, but the strategic pivot that explicitly accepts a near-term ARR trade-off to maximize MAU is new to late FY2025–FY2026 and dominates the Q2 2026 call. Freemium/MAU references rose sharply across the last three calls. |
| Creative Cloud pricing & line optimizations | persisted | Q4 2023, Q1 2024, Q2 2025, Q3 2025, Q1 2026, Q2 2026 | A recurring ARR lever — renewal price uplift and tiering (Creative Cloud Pro). In Q2 2026 management reversed course and deferred previously planned second-half line optimizations, calling it a phase shift rather than a cancellation. |
| Enterprise CXO / GenStudio / agentic marketing | persisted | Q3 2023, Q4 2023, Q1 2024, Q2 2024, Q4 2024, Q1 2025, Q2 2025, Q3 2025, Q4 2025, Q1 2026, Q2 2026 | The Digital Experience / enterprise story recurs every call, migrating from AEP and native apps to GenStudio content supply chain and, by FY2026, agentic Customer Experience Orchestration plus the Semrush deal. |
| Macro / consumer & advertising demand | dropped | Q3 2023, Q4 2023, Q2 2024, Q1 2025 | Macro jitters, consumer spend and (in Q1 2025) tariffs were a recurring analyst and management topic through early FY2025, then faded to near-absence by FY2026 as the conversation shifted entirely to AI and freemium. |
| Leadership transition (CEO & CFO) | emerged | Q1 2026, Q2 2026 | Absent from the earlier record, then emerged in Q1 2026 (Narayen's move toward Board Chair and CEO search) and intensified in Q2 2026 with CFO Dan Durn's departure and Steve Day's interim appointment. |
Guidance ledger
Quotes, calls, and speakers are source-verified; outcomes are curator-classified.
| Verbatim guidance | Call | Speaker | Curator outcome | Outcome note |
|---|---|---|---|---|
| “And we expect this AI book of business to double by the end of fiscal '25.” | Adobe Inc., Q1 2025 Earnings Call, Mar 12, 2025 · 2025-03-12T21:00:00 | Shantanu Narayen | kept | The AI-first book of business was >$125M exiting Q1 2025; by Q3 2025 management said the new AI-first products had already achieved the end-of-year target of over $250M. |
| “Digital Media net new ARR of approximately $550 million” | Adobe Inc., Q3 2024 Earnings Call, Sep 12, 2024 · 2024-09-12T21:00:00 | Daniel Durn | kept | The Q4 2024 target was met — Adobe reported net new Digital Media ARR of $578M for Q4 FY2024. |
| “For FY '25, we're targeting total Adobe revenue of $23.30 billion to $23.55 billion” | Adobe Inc., Q4 2024 Earnings Call, Dec 11, 2024 · 2024-12-11T22:00:00 | Daniel Durn | kept | The FY25 range was raised across the year and exceeded; Adobe reported record FY2025 revenue of $23.77B. |
| “This is the foundation for our FY '26 Total Adobe ARR growth target of over 10%” | Adobe Inc., Q4 2025 Earnings Call, Dec 10, 2025 · 2025-12-10T22:00:00 | Shantanu Narayen | pending | FY2026 is in progress; by Q2 2026 the total-Adobe ARR growth target was set at 10.2%, reflecting Semrush plus the freemium pivot and deferred line optimizations. |
| “For FY '26, we are targeting total Adobe revenue of $26.5 billion to $26.6 billion.” | Adobe Inc., Q2 2026 Earnings Call, Jun 11, 2026 · 2026-06-11T21:00:00 | Steven Day | pending | Raised full-year target set on the latest call (includes Semrush); FY2026 not yet complete in the supplied history. |
Q&A pressure map
Question counts and firms are curator tallies; analyst coverage shown above.
| Topic | Questions | Firms | Pressure / response |
|---|---|---|---|
| Freemium pivot & near-term ARR trade-off | 6 | Wells Fargo Securities, Wolfe Research, Evercore ISI, Jefferies, Barclays | The dominant line of questioning on the Q2 2026 call — why accelerate freemium now, the payback on the ~$0.5B ARR give-up, free-user LTV/stickiness, and whether to pivot even harder. On the direct payback-period question, management gave directional color (playing out over 2027) rather than the specific payback/multiple asked for. |
| Guidance conservatism & net-new-ARR modeling | 5 | Jefferies, Deutsche Bank, Wolfe Research, UBS, Morgan Stanley | On the Q1 2024 call, after a smaller-than-usual beat, multiple analysts pressed why the full-year guide wasn't raised and how to model the impact of price increases inside reported ARR; management reaffirmed rather than lifted the outlook. |
| When AI meaningfully moves revenue | 4 | Jefferies, Wolfe Research, JPMorgan | Recurring through FY2025, anchored by the Q1 2025 opener asking when the AI book of business becomes more than a low-single-digit percent of revenue; management answered with the new AI-first ARR disclosures and the doubling target. |
| Creative Cloud pricing / line optimization impact | 3 | Citigroup, Evercore ISI, Wells Fargo Securities | Analysts repeatedly probed the reaction to Creative Cloud Pro pricing and line-item optimizations (Q2 2025, Q3 2025), culminating in the Q2 2026 question on why deferring the increase is the right call. |
Language shifts
Only language evidence verified against the referenced component is shown.
| Observation | Verbatim evidence | Call ID | Component |
|---|---|---|---|
| New, explicit acknowledgment that the strategy sacrifices near-term ARR — a marked change from the prior beat-and-raise register that had emphasized record net new ARR. | “This shift will come at the cost of short-term ARR, but will accelerate user acquisition in MAU” | 1996469811 | 3 |
| Guidance language turned from raising and reaffirming targets to openly guiding a component of ARR lower — a meaningful shift in confidence framing on subscriber ARR. | “lowers our second half ARR growth expectations from individual subscribers” | 1996469811 | 2 |
| For contrast, as recently as Q4 2025 the CFO framed FY2026 in unqualified confident terms, underscoring how the Q2 2026 trade-off language is a genuine change in tone. | “we are confident in our ability to deliver industry-leading innovation, double-digit ARR growth and world class profitability” | 1967943306 | 5 |
The call history reframes the current debate: Adobe's execution and guidance track record has been strong (AI-first and net-new-ARR targets were repeatedly met or exceeded), but Q2 2026 marks a deliberate break — trading near-term subscriber ARR for freemium-driven MAU, deferring price optimizations, and doing so amid a CEO search and CFO change. The investment question shifts from 'can they hit the number' to 'will the freemium bet convert to durable monetization before the ARR give-up is felt.'
The Cash Franchise
Adobe sells the software that professionals use to make and manage digital content, almost entirely by subscription. Over a decade revenue quadrupled to $23.8 billion, roughly 96% of it recurring, and the business converted about 40 cents of every revenue dollar into free cash flow — $9.9 billion in fiscal 2025. Yet the stock has fallen about two-thirds from its 2021 peak even as that cash flow rose. This chapter establishes what the company is, how it earns, and why the gap exists.
What Adobe sells
Adobe organizes itself around two customer groups — creative and marketing professionals, and business professionals and consumers — served through three reporting segments [1]. Digital Media is the core: the Creative Cloud applications (Photoshop, Illustrator, Lightroom, Premiere Pro, After Effects), the Acrobat/Document Cloud family, Adobe Express, and the Firefly generative-AI tools [2]. Digital Experience is the enterprise marketing-software business — the Experience Platform, Journey Optimizer, and Marketo Engage — sold to brands to run campaigns and analytics [3]. A residual Publishing & Advertising segment rounds out the total.
The revenue is concentrated in the flagship. In fiscal 2025 Digital Media generated $17.6 billion and Digital Experience $5.9 billion; Publishing & Advertising contributed $0.3 billion [4].
Source: FY2025 Annual Report (Form 10-K), MD&A segment revenue [5].
Two facts about the revenue matter more than the segment labels. First, it is overwhelmingly recurring: subscription revenue was $22.9 billion of the $23.8 billion total in fiscal 2025 [6]. Second, the recurring base is still growing: Digital Media annualized recurring revenue reached $19.20 billion at the end of fiscal 2025, up 11.5% year over year [7]. A business that renews almost all of its revenue each year, and adds to it, is the kind whose tenth-year revenue is more forecastable than most.
The economics
Revenue (FY2025)
Subscription % of Revenue
Operating Margin
Free Cash Flow (FY2025)
FCF Margin
FCF Yield (current)
Sources: FY2025 Consolidated Statements of Income [8] and Cash Flows [9]; FCF yield derived from reported financials and the current share price.
The shape of the business is steady, high-margin growth. Revenue compounded from $5.9 billion in fiscal 2016 to $23.8 billion in fiscal 2025 — roughly 17% a year — and operating income tracked it, with operating margin holding in a 25–37% band throughout [10].
Source: FY2016–FY2025 Annual Reports (Form 10-K), Consolidated Statements of Income; FY2025 figures [11].
The cash conversion is the more important story. Free cash flow has grown every year of the decade bar one and has never dipped, rising from $2.0 billion in fiscal 2016 to $9.9 billion in fiscal 2025, with the FCF margin sitting between 34% and 44% the entire time [12]. Two features make that cash unusually clean. Capital spending is tiny — $179 million in fiscal 2025, under 1% of revenue — so operating cash flow and free cash flow are nearly the same number; there is no heavy-capex drag depressing the near-term yield [13]. And free cash flow has exceeded net income in every year, helped by a growing deferred-revenue balance — customers pay for subscriptions before Adobe records the revenue [14].
Source: FY2016–FY2025 Annual Reports (Form 10-K), Consolidated Statements of Cash Flows; FY2025 figures [15].
The balance sheet carries no meaningful strain against that cash. At the end of fiscal 2025 Adobe held $6.6 billion in cash and short-term investments against $6.15 billion of senior notes — roughly net-neutral — and those notes carry no financial covenants [16]. The debt is modest and long-dated, taken on partly to fund buybacks rather than to plug a hole.
What management does with the cash is buy back stock. Adobe repurchased $11.3 billion of its own shares in fiscal 2025 — more than the year's free cash flow — and the share count has fallen from 504 million in fiscal 2016 to 402 million by mid-fiscal-2026 [17]. That is a 20% reduction in shares outstanding, and the pace has accelerated as the price has fallen. Whether the buybacks are being funded at genuinely attractive prices, and how stock-based compensation of $1.9 billion offsets them, is work for a later chapter [18].
Source: FY2016–FY2025 Annual Reports (Form 10-K), Consolidated Statements of Income; Q2 FY2026 shares outstanding per the latest quarterly filing.
The dislocation
For a business with these economics, the share price has behaved strangely. Adobe peaked near $688 in November 2021 and traded at about $237 in mid-July 2026 — a decline of roughly two-thirds. Over the same window free cash flow rose about 43%, from $6.9 billion in fiscal 2021 to a trailing $10.1 billion. Rebasing both to 100 at the end of 2021 shows the divergence directly.
Source: derived from company share-price history and reported free cash flow, FY2021–FY2025 plus trailing twelve months to Q2 FY2026 (as reported).
At $237, and about 402 million shares, Adobe is valued near $95 billion. Against trailing free cash flow of roughly $10.1 billion that is a free-cash-flow yield of about 10.5% and an enterprise value of under 10 times free cash flow — an unusual price for a business earning 40% cash margins on 96% recurring revenue. At that price, the valuation implies the cash flows will not compound.
The reason is written into Adobe's own filings. The company now names "AI-first creativity and productivity tools" and "AI-first creative tools" among the competitors its core products face [19]. Generative AI both powers Adobe's products — Firefly is embedded across Creative Cloud — and lowers the barrier for new entrants to build content-creation tools that did not previously exist. Add a self-inflicted setback — the abandoned acquisition of design rival Figma, terminated in fiscal 2024 at a $1 billion termination fee [20] — and the derating has a narrative behind it. Whether that narrative describes a real erosion of the franchise or a fear that outran the cash flows is what the rest of this report weighs.
The question this report answers
The gap between a franchise whose cash flow keeps rising and a price that keeps falling is the reason Adobe is worth studying. Can Adobe keep converting its creative- and document-software franchise into roughly 40%-margin free cash flow for another decade as generative AI reshapes how content is made — and does a price down two-thirds from its peak, while free cash flow rose, reflect that risk or overstate it? Everything that follows tests one side of that question: how durable the moat actually is, whether the cash conversion holds up under scrutiny, what the recurring-revenue and balance-sheet signals say about the next ten years, and what price the market is really putting on the franchise.
Creative Cloud Moat
Adobe's advantage is real and shows up in the numbers: Photoshop, Illustrator, Premiere Pro and PDF are industry standards, 96% of revenue recurs, monthly active users of Acrobat and Express passed 750 million, and Digital Media ARR reached $19.20 billion still compounding at double digits. But durability and momentum are not the same thing. ARR growth has stepped down for five straight years, the FY2025 10-K now names "AI-first" tools as direct competitors, and the genuinely new AI revenue Adobe has built so far is roughly 1% of the book.
The question The Cash Franchise left open — whether generative AI erodes this franchise — turns on the moat's construction and on what the ARR line is already telling you. The moat holds today. The rate of change is where the debate lives.
What the moat is built from
Adobe's switching costs are not a slogan; they sit in file formats and installed habit. Photoshop is described in the filings as "the world's most advanced digital imaging and design app," Illustrator as "our industry-standard vector graphics app used worldwide," and Premiere Pro and After Effects as industry-standard tools for video and motion graphics [1]. The PSD, AI and PDF formats are the interchange layer of the professional content world; a studio, agency or enterprise that standardizes on them inherits a library, a training base, and a set of collaborators who expect the same tools. Leaving is not a software swap — it is a workflow migration.
Three numbers make the lock-in visible. Recurring revenue is 96% of the total (The Cash Franchise). Remaining performance obligations — contracted revenue not yet recognized — stood at $22.52 billion exiting FY2025, up 13% year over year, a backlog larger than a full year of Digital Media revenue [2]. And the top of the funnel is wide: monthly active users of Acrobat and Express surpassed 750 million, growing 20% year over year, feeding a free-to-paid conversion engine that the enterprise ETLA relationships sit on top of [3].
Digital Media ARR ($B)
RPO ($B)
Acrobat + Express MAU (M)
Sources: Digital Media ARR — FY2025 10-K, MD&A [4]; RPO and MAU — Q4 FY2025 earnings call [5].
The moat in the ARR line — and the deceleration
Digital Media ARR is the cleanest gauge of whether the franchise is holding. It has risen every year, from $12.24 billion exiting FY2021 to $19.20 billion exiting FY2025 [6][7]. That is a 12% compound rate over four years, achieved while the price fell two-thirds — the durability side of the case is not in doubt.
Sources: FY2021–FY2025 10-Ks, MD&A Digital Media sections [8][9][10][11][12].
The growth rate tells the other half of the story. Adobe's own reported year-over-year ARR growth has fallen in a straight line: 19% in FY2021, 15% in FY2022, 14% in FY2023, 13% in FY2024, and 11.5% in FY2025 [13][14]. Some of that is arithmetic — a larger base is harder to grow — and Adobe reports these rates largely on a constant-currency basis. But the direction has been unbroken through exactly the years generative AI moved from novelty to product.
Sources: growth rates as reported by Adobe (constant currency), FY2021–FY2025 10-Ks, MD&A [15][16].
Adobe's Digital Media ARR growth decelerated five straight years — 19%, 15%, 14%, 13%, 11.5% — to an ending $19.20 billion, and its standalone AI products reached only ~$250 million of AI Direct ARR (about 1% of that book), even as Figma grows 41% with 136% net dollar retention in the adjacent collaborative-design pool, and Adobe folds its three segments into one from FY2026, removing the standalone Digital Media growth line as the competitive question sharpens.
There is a genuine counterweight, and it belongs in the same breath. In absolute dollars, net new Digital Media ARR set a record in FY2025, and management said net-new growth "reaccelerated year over year," with over 75% of it coming from subscriptions, cross-sell and upsell rather than price increases [17]. A base that adds record dollars while its percentage growth slows is a large business behaving normally, not necessarily a franchise being taken apart. The percentage line is a warning to watch, not yet evidence of erosion.
AI: defending the moat more than widening it
Adobe's AI disclosures reward a careful read, because two very different numbers get discussed as one. The headline is that "total AI-influenced ARR exceeded one-third of our overall book of business" exiting FY2025 — on total Adobe ending ARR of $25.2 billion, that is more than $8 billion [18][19]. But "AI-influenced" counts existing subscriptions that now carry AI features. It is a retention and engagement measure — how much of the installed base touches AI — not a measure of new money.
The new money is a separate, much smaller figure Adobe labels "AI Direct ARR": the standalone AI products — Acrobat AI Assistant, the Firefly app and services, GenStudio for performance marketing. Management guided that book to surpass $250 million exiting FY2025, up from about $125 million [20][21]. At roughly $250 million, direct AI revenue is about 1% of the $19.20 billion Digital Media book. Management itself framed the strategy plainly — "drive the entire book of business with AI-influenced solutions" — which is a statement about defending and upselling the installed base, not yet about a new growth engine [22].
AI-influenced ARR (share of book)
AI Direct ARR ($M)
AI Direct as % of DM ARR
Sources: AI-influenced share — 2026 proxy and Q4 FY2025 call [23][24]; AI Direct ARR — Q2 FY2025 call [25]; AI Direct share derived against $19.20B Digital Media ARR [26].
Two further moves say more about how Adobe reads the threat than any margin figure. First, the FY2025 10-K, for the first time, names "AI-first" tools as direct competition — "AI-first creativity and productivity tools" for business professionals and consumers, and "AI-first creative tools" for creators [27]. Earlier filings framed competitors as software companies and point tools; the language changed because the competitive set did. Second, Adobe stopped trying to win on its own model alone. It opened Firefly to over 25 third-party models — Google, OpenAI, Black Forest Labs, Luma, Runway and others — metered through its generative-credit system [28]. That is a deliberate bet that the durable moat is the workflow and the interface where professional work happens, not the underlying model — a sensible hedge if model quality is commoditizing, and an implicit admission that owning the best model is not the plan.
The read, and what would change it
The evidence points to a wide but maturing moat. The switching costs are structural — file-format standards, a 750-million-user funnel, a backlog larger than a year of segment revenue — and they have kept ARR compounding at double digits straight through the arrival of credible AI-native rivals. Adobe's own AI is, so far, doing defensive work well: it is lifting engagement and retention across a book that is still growing, and the standalone AI products, while tiny, are growing from a base of zero.
The strongest fact against a complacent read is the growth line itself. Five consecutive years of deceleration, the first-ever naming of AI-first competitors, and a decision to embrace rival models rather than beat them are not the profile of a franchise widening its lead. The most likely path — a good business growing a little slower each year — is also what an early, gradual erosion would look like, and the two are hard to tell apart from a single year.
What would decide it is observable and falsifiable. Re-acceleration of net-new Digital Media ARR in dollars, and AI Direct ARR scaling from hundreds of millions toward the billions, would show AI turning from a retention lever into a growth engine — the moat widening. ARR growth breaking below roughly 10%, or net-new ARR rolling over in absolute terms, would be the first hard sign that AI-first tools are pulling work out of the funnel. Those are the two lines to watch; the franchise is durable enough that they, not the headlines, will settle the question.
Cash Quality
Adobe's free cash flow holds up under a forensic read. Operating cash flow has exceeded net income in every year of the past decade — a five-year average of about 1.46 times — receivables days fell rather than rose, and the balance sheet is net cash on well-laddered debt carrying no covenants. The one honest deduction: roughly $1.9 billion of annual stock-based compensation is a real cost the cash-flow statement adds back, and charging it moves the trailing cash yield from about 10% to about 8%.
Earnings turn into cash, consistently
The first test of a cash story is whether reported profit becomes cash. Adobe's does, and by a wide margin. Operating cash flow has run above net income every year since FY2016, and free cash flow has too — the gap is not a one-year fluke but a structural feature of a subscription model that collects in advance and spends almost nothing on physical assets.
Source: derived from reported financials, FY2016–FY2025 10-Ks; FY2025 figures per Consolidated Statements of Cash Flows [1].
Two things stand out. First, operating cash flow and free cash flow track each other almost exactly, because capital expenditure is trivial: $179 million in FY2025, about 0.8% of revenue [2]. This is the opposite of a capital-heavy operator whose free cash flow is depressed by reinvestment; there is no capex overhang to see through here, so operating-cash-flow consistency and free-cash-flow consistency are the same question.
Second, the series wavered exactly once. Free cash flow dipped from $7,396 million in FY2022 to $6,942 million in FY2023 — a 6% step down driven by higher cash taxes and working-capital timing — before resuming its climb to $9,852 million in FY2025. Over ten years, that is the only down year, and it recovered inside twelve months.
Operating Cash Flow / Net Income (5-yr avg)
Free Cash Flow / Net Income (5-yr avg)
Capex / Revenue (FY2025)
Source: derived from FY2021–FY2025 Consolidated Statements of Cash Flows and Income [3].
A five-year average of 1.46 for operating cash flow over net income is not a warning sign — it is the mark of a business that recognizes revenue ratably while collecting the cash up front. The accrual gap runs the healthy direction: cash arrives ahead of the profit it will later support, not behind it.
The stock-comp deduction
The cash-flow statement adds back $1,942 million of stock-based compensation in FY2025 as a non-cash item [4]. It is non-cash in the sense that no dollar leaves the building — but it is not free. Adobe pays a meaningful share of its workforce in stock, and that stock dilutes owners. The company then spends cash buying shares back to undo the dilution. A value investor should reckon the cash yield both ways.
Trailing FCF Yield (headline)
FCF Yield net of stock comp
Source: free cash flow $9,852M and stock-based compensation $1,942M per FY2025 cash-flow statement [5]; yield on a market value of roughly $95 billion.
Subtracting the full stock-compensation charge from free cash flow — the most conservative treatment — takes the trailing cash yield from about 10.4% to about 8.3% on a $95 billion market value. That still clears the reader's 8% threshold, but it is the honest number to underwrite, and it is the single largest adjustment on the page.
What redeems the picture is that the buyback is doing real work, not merely mopping up dilution. In FY2025 Adobe repurchased $11,281 million of stock and reissued only a small amount under compensation plans [6]. Treasury shares rose by 31 million from repurchases against 3 million reissued, so shares outstanding fell from 441 million to 413 million — a 6% net reduction in a single year [7].
The stock-comp add-back of $1.9 billion is about 17% of the $11.3 billion FY2025 buyback. The other 83% of repurchases genuinely shrinks the share count rather than offsetting dilution — the reduction from 441 million to 413 million shares is net of stock compensation, not before it.
The buyback also exceeded free cash flow — $11.3 billion returned against $9.9 billion generated — funded by drawing down cash and issuing $2.0 billion of new notes [8]. Returning more than the business earns is only prudent against a net-cash balance sheet and a depressed price; both hold here, and the next section shows the leverage taken on is negligible.
Working capital raises no flags
The forensic checklist for working capital asks whether cash is being flattered by stretching payables, or whether receivables or inventory are quietly building ahead of revenue. For Adobe, the answers are clean.
Source: derived from trade receivables and revenue, FY2020–FY2025 10-Ks; FY2025 balance sheet [9].
Days sales outstanding fell from roughly 43 in FY2021 to 36 in FY2025 — collection got faster, not slower. Receivables of $2,344 million did grow 13% in FY2025, a touch ahead of the 10.5% revenue growth, which shows up as a $275 million use of cash the filing attributes to billing timing [10], but off an improving multi-year base it is noise, not a trend. There is no inventory to monitor — this is software — so days-inventory does not apply. Trade payables are immaterial at $417 million, and total current liabilities actually fell year over year, so cash was not flattered by stretching suppliers [11].
The one working-capital line that matters is deferred revenue — and it is a source of cash, not a drain. Customers pay in advance, so a growing book of prepayments funds the business interest-free.
Source: FY2025 Annual Report, Note 2 — Revenue [12].
Deferred revenue reached $7.03 billion at the end of FY2025, up from $6.26 billion — about 108 days of revenue, far above the 30-day level at which a prepayment book becomes a genuine forward-demand signal [13]. The broader measure, remaining performance obligations — contracted revenue not yet recognized — stood at $22.52 billion, up 13% year over year, with about 65% expected to convert to revenue within twelve months [14]. A backlog growing faster than reported revenue is the clearest evidence in the filings that next year's revenue is largely already sold — and it bears directly on the reader's question of whether revenue a decade out can be higher than today's.
Deferred revenue is not debt, and the balance sheet is net cash
A common error in stress-testing a subscription company is to treat deferred revenue as a borrowing. It is not. Deferred revenue is a promise to deliver software, settled by providing a service that costs Adobe about 12 cents on the dollar to fulfill — not a claim for cash repayment. Only $80 million of the $7.03 billion is a refundable deposit, and a further 4% is committed funds convertible into other Adobe products [15]. The correct net-debt calculation excludes it, and Adobe's does.
Cash + Short-term Investments ($M)
Total Debt ($M)
Net Cash ($M)
Source: FY2025 Consolidated Balance Sheets [16].
Cash and short-term investments of $6.60 billion sit against $6.21 billion of carrying-value debt, leaving Adobe roughly $0.4 billion in net cash [17]. Were a reader to wrongly fold the $7.03 billion of deferred revenue into debt, the balance sheet would appear to carry about $6.6 billion of net obligations — but that overstates the true cash cost of those obligations by roughly nine times, because they are discharged by delivering high-margin software, not by writing checks.
The debt itself is conservatively structured. Adobe carries $6.15 billion of senior notes at par, laddered from 2027 to 2035, and the notes contain no financial covenants [18].
Source: FY2025 Annual Report, Note 17 — Debt [19].
The maturity ladder averages roughly four years, with no year concentrating more than $2.0 billion, and the blended effective rate is about 4.2% [20]. Cash paid for interest was just $246 million in FY2025 against $10.0 billion of operating cash flow — coverage of roughly forty times [21]. This is a debt load that exists to fund buybacks opportunistically, not a leverage risk to manage.
Tangible book is not the anchor
One measure that does look alarming in isolation is tangible book value. Shareholders' equity of $11.6 billion is less than the $12.9 billion of goodwill and $0.5 billion of other intangibles, so tangible book is negative — roughly minus $1.7 billion [22]. For most businesses that would be a red flag. Here it is an artifact of capital returns: Adobe has bought back $48.8 billion of its own stock, held in treasury, which has drawn reported equity down even as retained earnings climbed to $45.4 billion [23]. Price-to-book and tangible price-to-book are not meaningful anchors for a capital-light franchise that has spent two decades converting book equity into repurchased shares; the value sits in the cash the software throws off, not in the net assets on the balance sheet.
What would change this read
The cash-quality read is favorable but not unconditional. The lines to watch are specific and checkable in each 10-K: operating cash flow falling below net income (a ratio under about 1.2 would signal the accrual engine reversing); stock-based compensation rising as a share of revenue, which would widen the gap between headline and owner cash flow; days sales outstanding climbing back above the low-40s; and — the leading indicator for the reader's ten-year revenue question — deferred revenue and remaining performance obligations growing slower than reported revenue, which would say the forward book is thinning before the income statement shows it. On the FY2025 record, all four point the right way.
Implied Growth
At about $95 billion, Adobe trades at roughly 9.7 times consensus FY2026 non-GAAP earnings and 8.6 times FY2027 — against a software-sector median near 22 times. A reverse discounted-cash-flow, discounting at 10% and charging stock compensation as a cost, shows the price embeds essentially no long-run growth in owner cash flow. The company guides to about 10% ARR growth. Whether the near-zero implied rate or the guided rate is the better estimate is a judgment about the moat.
Where the multiple sits
Adobe earned $16.70 of GAAP diluted EPS in FY2025 and $20.94 on a non-GAAP basis [1]. Consensus looks for non-GAAP EPS of about $24.42 in FY2026 and $27.53 in FY2027, on revenue of roughly $26.5 billion and $28.9 billion. Against a July 2026 price of $237.25, that is a forward multiple that has compressed to single digits.
Sources: FY2025 actuals and FY2026 targets from the Q4 FY2025 earnings call [2] [3]; consensus EPS from the analyst estimate feed; P/E computed at $237.25.
Fwd P/E — FY2026 non-GAAP
Fwd P/E — FY2027 non-GAAP
FY2026 earnings yield
EV / trailing FCF (x)
Sources: computed from consensus non-GAAP EPS and FY2025 free cash flow of $9.85 billion (operating cash flow $10.03 billion less $0.18 billion capex) [4]; price and estimates from the market-data feed.
A single-digit forward multiple is unusual for a business still guiding to double-digit ARR growth and a roughly 45% non-GAAP operating margin [5]. It is the market's answer to what Creative Cloud Moat framed: whether generative AI turns that growth into decline.
The stock-comp wedge
The cheap-looking multiple rests on the non-GAAP number, and the distance between the two earnings bases is mostly stock-based compensation — the same $1.9 billion add-back that Cash Quality charged against free cash flow. On GAAP earnings the multiple is not 9.7 times but about 14 times trailing and roughly 13 times the FY2026 GAAP guide of $17.90 to $18.10 [6]. Both numbers are real; which one an investor underwrites decides whether the stock is priced at a deep discount or a moderate one.
Sources: FY2025 actuals and FY2026 GAAP/non-GAAP guidance from the Q4 FY2025 call [7] [8]; consensus from the estimate feed.
The FY2026 guide itself carries a note worth registering: management targets revenue of $25.9 to $26.1 billion, below the roughly $26.5 billion consensus [9]. Adobe has a long record of guiding conservatively and beating, so the gap is not alarming on its own; but the honest forward multiple is the one built on the company's own numbers, and that is closer to 10 times non-GAAP and 13 times GAAP than to the 8.6 times the FY2027 line implies.
What the price implies
The most useful way to read a compressed multiple is to invert it: solve for the growth the price already assumes, then compare it to what the business is doing. Discounting future free cash flow at 10% with a 3% terminal rate, and using FY2025 free cash flow of $9.85 billion as the base, today's roughly $95 billion equity value is consistent with owner cash flow shrinking about 3% a year over the next decade. Charge the $1.9 billion of stock compensation against that base — the conservative owner-earnings treatment — and the implied path is roughly flat, near 0% a year.
Source: reverse DCF derived from reported FY2025 free cash flow [10] (10% discount, 3% terminal); ARR and revenue growth from the Q4 FY2025 targets [11] and consensus.
The result is not sensitive to reasonable changes in the discount rate. On the stock-comp-charged base, the implied ten-year growth is about −1.8% at a 9% discount rate and +2.0% at 11%; on headline free cash flow it stays negative across that range. The contrast with what Adobe is actually doing is the whole point: the company guides to 10.2% ARR growth and roughly $2.6 billion of net-new ARR in FY2026 — its highest opening guide on record [12] — while the price is set as though the cash flows have already stopped compounding.
If Adobe grows owner cash flow even at half its guided ARR rate for a few years before fading, the shares are worth more than $237; if the AI-driven deceleration Creative Cloud Moat traced — five straight years of slowing ARR growth to 11.5% — continues to a genuine stall, roughly flat is the right assumption and the stock is close to fair. The reverse-DCF does not resolve that; it prices it.
The forward cash yield
Cash Quality established the trailing free-cash-flow yield at about 10.4% headline and 8.3% once stock compensation is charged. Rolling that forward does not change the picture much, because free cash flow grows roughly in line with the business. Adobe has converted about 40% of revenue to free cash flow with great consistency; applied to FY2026 revenue near $26 billion, that implies forward free cash flow around $10.4 billion, or a headline yield near 11%. Charging about $2.1 billion of stock compensation brings the forward owner-earnings yield to roughly 8.5% — still above the 8% threshold the reader screens on, but only just, and only because the cash base is growing.
Source: trailing figures from FY2025 cash flow [13]; forward estimates derived by applying Adobe's ~40% FCF margin to FY2026 revenue guidance [14] and charging stock compensation. Forward figures are estimates, not guidance.
The forward cash yield and the reverse-DCF say the same thing from two directions. An investor is paid a high-single-digit owner-earnings yield to hold Adobe, and the price asks for almost no growth on top of it. Both are attractive if the franchise holds and unremarkable if it fades.
Whether it clears the options screen
One of the reader's standing tests is whether Adobe supports a liquid, long-dated at-the-money options market — the universe screen for an options-based approach. It does, comfortably. Adobe is a roughly $95 billion S&P 100 and Nasdaq-100 constituent whose listed options run from weeklies out through LEAPS expiring more than a year forward, into 2027 and 2028, with the at-the-money strikes among the most actively traded in large-cap software.
Implied volatility reflects the derating rather than distress. Thirty-day at-the-money implied volatility sits near 32% on a constant-maturity basis, with a mid-2026 reading around the low-40s that ranked in the low-60s percentile of its trailing year — elevated after a stock that has fallen roughly two-thirds from its 2021 peak, but well short of event-level stress. For an investor sizing long-dated positions, the practical conclusion is that liquidity is not a constraint here; the constraint is the fundamental question the rest of this report examines.
Source: options market data (listed expirations, at-the-money implied volatility), third-party market data as of mid-2026; not sourced to the filing corpus.
What would change the read
The bullish reading of this chapter — a high-single-digit owner yield on a franchise the price assumes will barely grow — depends on the deceleration stopping somewhere above zero. The strongest fact against it is that the people closest to the fundamentals are moving the other way: sell-side sentiment is a Hold, with a mean target near $272 but a widening tail, and at least one major bank cut Adobe to its most negative rating in July 2026 with a $190 target, explicitly on AI competition and the absence of a near-term catalyst. If the FY2025 net-new-ARR reacceleration proves to be Creative Cloud Pro repricing rather than durable demand, and ARR growth breaks below roughly 10% with net-new rolling over, the flat-to-declining path the price implies becomes the base case rather than the bear case — and a 9.7 times forward multiple on decelerating non-GAAP earnings is not the bargain it appears. The valuation is undemanding; whether it is cheap is a judgment about the moat, not the multiple.
Source: analyst ratings, price targets, and the July 2026 downgrade from third-party market and news data; not sourced to the filing corpus.
Sizing the Rivals
Adobe's Digital Media ARR growth decelerated five straight years — 19%, 15%, 14%, 13%, 11.5% — to an ending $19.20 billion, and its standalone AI products reached only ~$250 million of AI Direct ARR (about 1% of that book), even as Figma grows 41% with 136% net dollar retention in the adjacent collaborative-design pool, and Adobe folds its three segments into one from FY2026, removing the standalone Digital Media growth line as the competitive question sharpens.
Size both sides in the numbers as reported. Adobe's Digital Media book ended FY2025 at $19.20 billion of ARR, part of $25.2 billion of total company ARR [1]; against that, the standalone AI products Adobe has built so far — roughly $250 million of AI Direct ARR [2] — are about 1.0–1.3% of that book, while Figma, at $1.06 billion of revenue [3], is roughly 6% of Digital Media. The counter belongs in the same breath: net-new Digital Media ARR set a record in dollars in FY2025, with over 75% of it from subscriptions, cross-sell and upsell rather than price [4], and Figma's stronghold is the adjacent interface-and-product-design pool Adobe never won, not the imaging, photography and video work that anchors Creative Cloud. A slowing growth rate on a book still adding record dollars is a large franchise compounding, not a core being pulled out — the distinction the rest of this chapter sizes.
Two competitive fronts
Adobe faces competition on two distinct fronts, and conflating them overstates the danger. The first is an adjacent land-grab: well-funded software companies — Figma in collaborative interface design, Canva in prosumer and small-business creation — expanding into design work Adobe historically underserved. The second is generative substitution: image and video models (Midjourney, OpenAI, and a growing model layer) that commoditize the single act of "generate an asset" which Photoshop and Firefly monetize. Adobe's FY2025 10-K now names both — "web- and mobile-first design platforms" and "AI-first creativity and productivity tools" — as competition across every customer group [5]. The two fronts carry different economics, and the first is the one that shows up in a rival's revenue today.
That distinction is the missing external evidence behind the moat question the Creative Cloud Moat chapter left open: whether Adobe's decelerating-but-double-digit ARR reflects a franchise holding its base while ceding the fastest-growing new pools.
The field, sized
Adobe Digital Media Revenue ($M)
▲ 11% YoY
Figma Revenue ($M)
▲ 41% YoY
Canva ARR ($M, est.)
▲ 35% YoY
Figma Net Dollar Retention
Sources: Adobe Digital Media revenue and growth, FY2025 10-K [6]; Figma revenue, growth and retention, FY2025 10-K [7] [8]; Canva figures are privately reported and unaudited.
The magnitudes set the scale of the contest. Adobe's Digital Media segment — Creative Cloud, Document Cloud, Express and Firefly — booked $17,649 million in FY2025, up 11% and 74% of company revenue, at a 95% gross margin [9] [10]. Figma turned over $1,056 million, up 41% [11]. Canva, still private, has publicly reported roughly $4 billion in annualized revenue growing about 35%, with 265 million monthly active users and its enterprise tier reaching roughly 95% of the Fortune 500. Autodesk — the closest listed design-software peer, in 3D, CAD and media — earned $7.2 billion, up 17.5%.
Sources: Adobe FY2025 10-K [12] [13]; Figma FY2025 10-K [14]; Autodesk FY2026 income statement [15]; Canva figures privately reported and unaudited.
Two things follow. Adobe remains, by a wide margin, the largest and by far the most profitable operator in the field: neither high-growth challenger yet earns a GAAP profit, and Figma's 41% growth comes at a 122% GAAP operating loss margin, cushioned by initial-public-offering stock compensation. And a mature, listed peer — Autodesk — grows faster than Adobe while earning a real margin, which locates Adobe's 11% growth as the low end of design software rather than an industry in decline.
Figma: expansion in the segment Adobe tried to buy
Figma is the most instructive rival because it competes exactly where Adobe conceded. Adobe agreed to buy Figma for $20 billion in 2022, abandoned the deal under regulatory pressure in 2023, and paid a $1 billion termination fee — cash that helped capitalize the competitor now in the market against it [16]. Adobe's own answer in this category, Adobe XD, was wound down. Figma listed on the NYSE in July 2025.
What Figma discloses is the metric Adobe does not: retention. Figma's net dollar retention was 136% in FY2025, up from 122% two years earlier — existing customers spent 36% more year over year [17]. Its customers paying more than $100,000 a year rose from 630 to 1,405 across two years, and those above $10,000 from 7,233 to 13,861 [18]. In the collaborative-design budget, spend is expanding and consolidating on Figma, not Adobe — and sell-side commentary now describes Figma as the industry standard in product design.
Source: Figma FY2025 10-K, Key Business Metrics [19].
The scale caveat matters as much as the trajectory. At $1.06 billion of revenue, Figma is about 6% of Adobe's Digital Media segment, and its stronghold — interface and product design — is adjacent to, not inside, the imaging, photography and video work that anchors Creative Cloud. Figma is taking a category Adobe never won, at a size that is still small against the incumbent core.
Generative substitution and the model layer
The second front is harder to size because the substitutes are mostly free or bundled. Text-to-image and text-to-video tools from Midjourney, OpenAI and others let non-professionals generate assets that once required a Creative Cloud seat, and they improve monthly. Adobe's response is to treat the model as a component rather than the product: its FY2025 10-K describes offering both its own commercially safe Firefly models and "an extensive ecosystem of third-party models," letting customers choose the model inside Adobe's applications [20].
The bet is that durable value sits in the workflow — the canvas, the file formats, the collaboration and the enterprise controls — not in whichever model is best this quarter. Figma is making the identical wager: its Figma Weave product "brings the world's leading AI models together with professional editing tools on a single, browser-based canvas," letting users pick Sora, Veo, Flux or others for a task [21]. That two independent incumbents converge on model-agnostic workflows is evidence the workflow layer is where the industry expects margin to accrue — but it is a shared thesis, not a proven moat, and it concedes that the generation step itself is commoditizing.
A ceiling more than a cliff
The measured read: the competition is real and now quantifiable, but the evidence does not show Adobe's installed Creative base being pulled out. It shows the challengers capturing the faster-growing new pools — collaborative interface design and non-designer creation — while Adobe's professional core renews, which is consistent with a franchise growing 11% rather than one losing revenue. The risk this frames is slower growth, not a near-term contraction in revenue, and it fits the price already discussed in Implied Growth: a market valuing the franchise as though growth fades toward a stall.
The strongest fact against that read is Figma's retention. Net dollar retention of 136% and a $100,000-plus customer count that more than doubled in two years show enterprise design budgets compounding on a rival — and Adobe discloses no comparable retention figure of its own, so a deterioration behind its held 11% growth could be masked, particularly with FY2025 Creative Cloud price actions flattering reported ARR. That visibility gets worse, not better: from Q1 FY2026 Adobe collapses its three reportable segments into one, removing the standalone Digital Media growth line exactly as the question sharpens [22].
What would turn slowing growth into an actual decline: Figma's expansion pattern spreading from interface design into Adobe's imaging and video core; a listed rival disclosing accelerating share of enterprise creative seats; or Adobe's own net-new ARR rolling over once the segment veil lifts and price effects normalize. Absent those, the challengers are growing fast in the rooms next door — not yet inside Adobe's.
Capital Allocation
Adobe returns essentially all of its cash to shareholders through buybacks, and the timing has run counter-cyclical: it spent the least at its 2021 price peak and the most — more than a full year's free cash flow — as the stock fell to multi-year lows, retiring about $45.7 billion of stock over the decade. It funds its AI response internally at 18% of revenue rather than by acquisition. The aborted Figma deal, which cost $1 billion for nothing, is the clearest evidence that the discipline is not guaranteed.
Repurchased, FY16–25 ($B)
Buyback Authority Left ($B)
R&D, FY2025 ($B)
Dividends Paid, Ever ($)
Sources: FY2025 Form 10-K, Consolidated Statements of Cash Flows and Stock Repurchase Program [1], operating-expense detail [2]; decade totals derived from FY2016–FY2025 cash-flow statements.
The Buyback Engine
Buybacks are the whole capital-return story. Over FY2016–FY2025, Adobe repurchased roughly $45.7 billion of its own stock — about 80% of the $56.8 billion of free cash flow it generated in the same span — and never paid a dividend. The cumulative effect sits on the balance sheet as $48.8 billion of treasury stock at cost, against which shares outstanding fell from 441 million to 413 million in the last year alone [3].
Source: FY2025 Form 10-K, Consolidated Statements of Cash Flows [4]; FY2016–FY2022 from prior-year cash-flow statements as reported.
The more useful pattern is the timing. Repurchases were smallest, relative to the cash coming in, in the years the stock was most expensive, and largest in the years it was cheapest. In fiscal 2021 the shares averaged about $561 and touched $688; Adobe spent $3.95 billion, roughly 57% of that year's free cash flow. In fiscal 2025 the shares averaged about $377, and it spent $11.28 billion [5] — 115% of free cash flow. In both fiscal 2024 and fiscal 2025 the buyback ran ahead of the cash generated, funded by drawing down the cash balance and by issuing $1.99 billion of new senior notes each year [6].
Sources: buybacks from FY2023–FY2025 Form 10-K cash-flow statements [7] and prior-year filings; average share price from market data; buyback/FCF derived.
The discipline is real but not absolute. Fiscal 2024 spending of $9.5 billion came at an average price near $525 — well above the fiscal 2022 and fiscal 2023 levels — so this is a company that leaned in as the multiple compressed, not one that waited for a bottom. The direction, though, is favorable for per-share compounding: retiring stock at roughly nine times free cash flow lifts free cash flow per share several points a year even if the business as a whole merely holds. Adobe's roughly $95 billion equity value is consistent with owner cash flow growing about 0% a year in perpetuity even on the conservative stock-comp-charged basis (an ~8.3% SBC-charged trailing free-cash-flow yield, down from a ~10.4% headline), yet because Adobe retires 4-7% of its shares each year by repurchasing at about 9x free cash flow, per-share owner free cash flow still compounds mid-single-digits on flat aggregate cash — so the stall the price embeds applies to the whole company, not to the owner of a share. As of November 2025, $5.90 billion remained under the $25 billion authorization the board approved in March 2024, which runs through March 2028 [8].
No Dividend
Adobe has never paid a cash dividend and states it does not anticipate paying one "in the foreseeable future" [9]. The entire return of capital therefore flows through repurchases. That choice is defensible for a business trading at a high-single-digit free-cash-flow yield — buybacks at that price are more accretive than a dividend, and they avoid committing to a payout the company would be reluctant to cut. The trade-off is that the value of the return is entirely a function of the price paid: there is no dividend floor, and a management team that repurchased stock indiscriminately at any multiple would be reducing value per share without it ever showing up as a reported loss. On the record so far, the price paid has trended the right way.
Build First, Buy Rarely
Away from buybacks, Adobe's default is to build. Research and development ran $4.29 billion in fiscal 2025, up from $3.47 billion in fiscal 2023, and has held at 18% of revenue throughout — this is where Firefly and the generative features discussed elsewhere were funded, without an acquisition [10].
Source: FY2025 Form 10-K, operating-expense detail; research and development held at 18% of revenue in each year [11].
The two exceptions to the build-first pattern define the range of the acquisition question.
Figma. In September 2022 Adobe agreed to buy Figma for approximately $20 billion, half cash and half stock — about the size of its entire fiscal 2024 and fiscal 2025 buybacks combined. Regulators in Europe and the UK objected, and in December 2023 the two sides terminated the deal. Adobe paid Figma a $1 billion termination fee, recorded in fiscal 2024 operating expenses and not tax-deductible [12]. The full deal-level cost is taken up in The M&A Record; what matters for capital allocation is that the same management that repurchases stock counter-cyclically was willing to pay a full-cycle price for a fast-growing rival, and only an antitrust intervention stopped it.
Semrush. The more recent deal is smaller and different in character. In April 2026 Adobe completed the acquisition of Semrush, a search-and-brand-visibility platform, for $1.87 billion, primarily in cash. About $1.25 billion of the price — two-thirds — was recorded as goodwill, and Adobe told investors the acquisition was not material to its consolidated results [13]. It slots into the marketing side of the business — the segment where search-engine and "generative-engine" optimization matter — and is a tuck-in, not a franchise bet. It is excluded from the fiscal 2026 guidance the company has issued.
The pattern that emerges: Adobe overwhelmingly builds, returns the rest through buybacks, and reaches for acquisitions rarely — but when it does reach, as with Figma, it has shown a willingness to pay prices that its own buyback discipline would never justify.
Stewardship and Alignment
The person setting this policy has been in place a long time. Shantanu Narayen has been chief executive since December 2007 and also chairs the board, a combined role balanced by a lead independent director [14]. Long tenure through the subscription transition is a point in management's favor; combining the chair and CEO roles is the standard governance caution, mitigated but not eliminated by the independent-director structure.
Alignment runs through pay, not ownership. Insider stakes are small: all directors and current executive officers together hold 803,767 shares — well under 1% of the company — with Narayen himself holding 438,975 [15]. The largest holders are the index complexes, Vanguard at 10.2% and BlackRock at 9.3% [16]. This is a professionally managed large-cap, not an owner-operator: management is incentivized by equity compensation — the same stock-based compensation the buyback partly offsets — rather than by a large personal stake. That is neither unusual nor disqualifying, but it means the counter-cyclical buyback record, not insider skin in the game, is the evidence that management's interests track a long-term owner's.
What Would Change the Read
On the evidence, capital allocation is shareholder-oriented and, on buybacks, counter-cyclically disciplined: Adobe has retired roughly a fifth of its share base by returning about 80% of a decade's free cash flow at a falling multiple, while funding its product response internally. The strongest fact against that read is the Figma episode — a $20 billion agreement at roughly 50 times revenue that ended in a $1 billion, un-shielded write-off. Two things would change the read. A return to large, richly-priced, dilutive acquisitions would show the Figma instinct was the rule rather than the exception. And a buyback that kept running at fiscal-2025 scale after a sharp re-rating — repurchasing heavily at a high multiple — would turn the current strength into the invisible value destruction that all-buyback policies risk. Neither is visible in the record through fiscal 2025.
Digital Experience
Adobe's second reporting segment, Digital Experience, generated $5.86 billion in fiscal 2025 — about a quarter of company revenue — and has grown 3.6x over a decade to a mostly-subscription (92%) enterprise-marketing franchise. Its gross margin has climbed to 72% as low-margin services run off. But it now grows roughly 9% a year, slightly slower than the creative core, its true operating margin is undisclosed, and fiscal 2025 is the last year Adobe reports it as a standalone segment.
A second franchise inside Adobe
Everything prior chapters established about the cash franchise — the 95%-gross-margin Creative and Document engine, the moat, the ARR machine — describes Digital Media. It is 74% of revenue. The other quarter is Digital Experience: the Adobe Experience Cloud stack sold to marketing organizations, built from Adobe Analytics, Adobe Experience Manager, the Real-Time Customer Data Platform, Adobe Commerce, Marketo Engage, Campaign, and GenStudio for Performance Marketing [1]. Where Digital Media is largely self-serve, Digital Experience is enterprise software: direct sales, multi-year contracts, and implementation.
It is not a rounding item. Digital Experience revenue reached $5.86 billion in fiscal 2025, up from $5.37 billion, and its subscription revenue grew to $5.41 billion — 92% of the segment [2]. Over ten years the segment has compounded from $1.63 billion to $5.86 billion, a second recurring-revenue business grown inside the first.
DX Revenue (FY2025)
Share of Adobe Revenue
Segment Gross Margin
Subscription Mix
Sources: FY2025 10-K segment note [3] and Management Discussion and Analysis [4]; share of revenue derived from total revenue of $23.77 billion [5].
Source: FY2025 10-K segment note for FY2023–FY2025 [6]; earlier years from company filings as reported. The step up in FY2019 reflects the full-year effect of the 2018 Marketo and Magento acquisitions.
Growth that tracks the core, not outruns it
The intuitive case for Digital Experience is that it is the faster-growing engine — the enterprise business that keeps company revenue climbing as the creative franchise matures. The numbers do not support that framing. Digital Experience revenue grew 9% in fiscal 2025 and 10% in fiscal 2024; Digital Media grew 11% in both years [7]. The enterprise segment is now growing a point or two slower than the creative core, not faster.
Both engines have decelerated toward the same high-single-digit zone. After the post-pandemic rebound (Digital Experience grew 24% in fiscal 2021), the segment's growth stepped down each year — 14%, 11%, 10%, 9% — settling roughly where Digital Media sits. On a subscription-only basis the picture is a shade better: Digital Experience subscription revenue grew 11% in fiscal 2025, faster than the 9% headline, because the segment's remaining non-subscription services revenue is shrinking [8].
Source: derived from reported segment revenue, FY2020–FY2025 10-Ks [9].
For the reader's standing question — whether revenue in year ten is very likely higher than today — Digital Experience is a genuine second leg but not a rescue. A $5.9 billion franchise growing high-single digits adds meaningful, mostly-recurring revenue on top of the creative engine, which supports the direction of travel. What it does not do is accelerate to offset any maturation in Digital Media; on current trend it decelerates alongside it. The competitive picture that Sizing the Rivals drew for the creative side has an enterprise analogue Adobe does not quantify — Digital Experience competes with Salesforce, and its held-share is not disclosed.
Margins you can see, profits you cannot
Digital Experience carries a 72% gross margin — well below Digital Media's 95%, but rising: 67% in fiscal 2023, 70% in fiscal 2024, 72% in fiscal 2025 [10]. The expansion is mechanical and durable: segment cost of revenue was essentially flat at about $1.6 billion across those three years while revenue grew roughly 20%, as hosting scaled and lower-margin professional-services revenue ran off. The gap to Digital Media reflects what enterprise software costs to deliver — cloud infrastructure and implementation that a self-serve creative subscription does not carry.
Source: FY2025 10-K segment note and subscription-by-segment disclosure [11].
The limitation is that gross margin is as far down the income statement as the segment disclosure goes. Adobe's CODM "reviews revenue and gross margin information for each of our segments" but "does not review operating expense or asset information on a segment by segment basis" [12]. So the segment's operating margin — after the direct sales force, marketing, and research and development that enterprise software demands — is not reported. Given that Digital Experience needs a field sales organization that self-serve Creative Cloud does not, its operating margin is very likely well below the company's ~45% non-GAAP blended level. How far below is a genuine blind spot: a reader can see that Digital Experience produces $4.2 billion of gross profit, but not how much of that survives to operating income.
Where enterprise AI shows up in the numbers
The most useful thing about Digital Experience for the investment case is that it is where Adobe's enterprise AI monetization actually appears. In Digital Media, AI-first revenue (Firefly and the like) is still around 1% of the book. In Digital Experience, the AI-native components are the fastest-growing pieces: subscription revenue for the Adobe Experience Platform and its native apps grew over 40% year over year, and AEP now runs at scale — over 35 trillion segment evaluations and more than 70 billion profile activations a day [13]. Ending ARR for GenStudio — the content-supply-chain offering that stitches the creative and marketing sides together — grew over 25% [14].
Management frames the opportunity as the content supply chain — the 10% to 20% of a marketing budget spent on content creation and production, which GenStudio aims to make cheaper and faster [15]. The economics management offered are concrete enough to be checkable: for one media customer spending roughly $10 million a year on core creative products, Adobe sold about $7 million of additional Firefly Services and Firefly Foundry — a managed service training custom models on the customer's own content [16]. That is the AI upsell the bull case needs made visible in a single account, though one rounded example is not a segment trend.
The Semrush acquisition lands here too. Adobe announced its intent to buy Semrush for an equity value of about $1.9 billion in all cash, expected to close in 2026, with a negligible non-GAAP EPS impact in the first year and accretion thereafter [17]. It extends Digital Experience into brand visibility across search and large-language-model results — the "agentic web" — and, as Capital Allocation noted, is a disciplined tuck-in rather than a Figma-scale bet. The enterprise base is consolidating: customers with ARR over $10 million grew 25% year over year to more than 150 [18].
The honest weight to put on all of this: these are the segment's fastest-growing lines, but they are also its smallest, and Adobe does not size AEP, GenStudio, or the AI apps in dollars. The 40%-plus and 25%-plus growth rates are real, but off bases small enough that the whole segment still grew only 9%.
The segment line disappears in FY2026
There is a reporting wrinkle that matters for anyone trying to monitor this second engine. From fiscal 2026, Adobe stops reporting Digital Media, Digital Experience, and Publishing and Advertising as separate segments and reports by customer group instead — Business Professionals and Consumers, and Creative and Marketing Professionals [19]. Digital Experience's enterprise-marketing revenue folds into Creative and Marketing Professionals alongside professional Creative Cloud, a line that was $16.3 billion in fiscal 2025 [20]. Adobe's fiscal 2026 targets are already given only in the new form: Creative and Marketing Professionals subscription revenue of $17.75–17.9 billion, with no standalone Digital Experience line [21].
So fiscal 2025 is the last clean read on this business. From here, the ~$5.9 billion enterprise franchise becomes a component of a $17.9 billion blended line — its growth, its 72% gross margin, and its AI-native inflection all folded into a number dominated by the creative core. The disclosure regression Sizing the Rivals flagged for Digital Media applies with equal force to the second engine.
The measured read: Digital Experience is a real, large, high-retention second franchise that strengthens the case that Adobe's revenue is higher in a decade — but it grows in line with the core, its true profitability is undisclosed, and it is about to become harder to see. What would change this read upward is direct evidence that the AI-native lines (AEP, GenStudio, Semrush) are large enough to lift the whole segment back into double digits; what would change it downward is the blended customer-group line growing more slowly than Digital Experience did alone, which would signal the enterprise business decelerating unseen.
The M&A Record
Adobe built its entire second engine by acquisition, yet it has never written any of it down. Two-thirds of its $12.86 billion of goodwill sits in Digital Experience, assembled from Marketo, Workfront and a string of smaller deals — and a decade of annual impairment tests has produced no charge, while the acquired intangibles have quietly amortised to a $0.50 billion stub. The deals were sized to be individually immaterial. The one exception was Figma, a franchise-scale, roughly 50x-revenue reach that regulators blocked and that cost more than $1 billion to walk away from.
Goodwill, FY2025 ($B)
Goodwill in Digital Experience
Acquired Intangibles, Net ($B)
Figma Walk-Away Cost ($B)
Sources: FY2025 Form 10-K, Note 8 Goodwill and Other Intangibles [1]; Figma cost is the $1.0B termination fee plus $0.21B of non-deductible tax, per the FY2024 Form 10-K [2].
A Decade of Tuck-Ins
Adobe's acquisitions cluster in one place and one purpose: building Digital Experience, the enterprise-marketing business it did not have organically. The 2018 purchase of Marketo for approximately $4.75 billion in cash — bought from private-equity owner Vista Equity Partners — was the anchor, and the largest deal the company has ever completed [3]. Workfront followed in December 2020 for about $1.52 billion, also folded into Digital Experience [4]. On the Digital Media side, the deals were smaller still: Frame.io, a video-collaboration platform, for roughly $1.18 billion in 2021 [5], and Allegorithmic, a 3D-texturing tool, for about $161 million in 2019 [6].
Sources: Marketo Form 8-K [7]; Workfront, Frame.io and Allegorithmic from FY2021 Form 10-K Note 3 [8]; Figma from FY2024 Form 10-K Note 3 [9]; Semrush from the Q2 FY2026 Form 10-Q [10]. Magento (2018 commerce) built the same marketing stack, but its purchase price is not disclosed in this corpus's filings.
The common thread is size relative to Adobe. For every completed deal above, the company declined to present pro-forma financials because "the impact to our Consolidated Financial Statements was not material" [11]. These are bolt-ons bought with cash off the balance sheet, not deals large enough to threaten the company. Set against the roughly $45.7 billion Adobe returned to shareholders through buybacks over the same decade — quantified in Capital Allocation — the entire acquisition programme is the smaller use of capital by a wide margin.
Goodwill That Never Broke
The clearest evidence on whether these deals held their value is what did not happen: no impairment. Goodwill jumped from $10.74 billion in fiscal 2020 to $12.67 billion in fiscal 2021 as Workfront and Frame.io closed [12], and has sat essentially flat ever since — $12.79 billion, $12.81 billion, $12.79 billion and $12.86 billion across the four following years [13]. Each year Adobe ran its annual impairment test and, on a qualitative assessment, "determined there was no impairment of goodwill" [14].
Sources: FY2020–FY2021 from the FY2021 Form 10-K balance sheet [15]; FY2022 from the FY2022 Form 10-K balance sheet [16]; FY2023–FY2025 from the FY2025 Form 10-K Note 8 [17].
Two details make the picture more solid than a flat line alone. First, the goodwill is concentrated where the buying happened: $8.55 billion of the $12.86 billion total sits in Digital Experience, $3.91 billion in Digital Media, confirming that the enterprise segment is largely an acquired construction rather than an organic one [18]. Second, the identifiable intangibles from these deals have almost fully run off: gross carrying value of $2.52 billion is now $2.03 billion amortised, leaving just $0.50 billion net, down from $0.78 billion a year earlier, with the related amortisation expense falling to $310 million in fiscal 2025 from $375 million in fiscal 2023 [19]. The acquisition wave of 2018–2021 is, in accounting terms, digested: the customer relationships and technology bought back then have been expensed through the income statement, the drag is fading, and what remains on the balance sheet is goodwill the company continues to certify as unimpaired.
The honest limit on this evidence is that a clean impairment record proves durability, not return. Goodwill tests are lenient — a large, growing, cash-generative consolidated entity rarely trips one even if an individual deal disappointed — and Adobe discloses no deal-level revenue or return-on-invested-capital for Marketo, Workfront or Frame.io. What the record shows is that none of these deals blew up, not that each earned its cost of capital. That is a lower bar than a value investor would ideally want cleared, but it is the bar the filings can actually verify, and Adobe clears it.
The Figma Exception
Everything above describes a company that buys small and integrates cleanly. Figma is the counter-example that defines the boundary. In September 2022 Adobe agreed to acquire the design-collaboration company for approximately $20 billion — half cash, half stock — a price on the order of 50 times Figma's roughly $400 million of annual recurring revenue at the time [20]. This was not a bolt-on; it was more than the company's entire cumulative goodwill balance, and it would have been Adobe's first franchise-scale, stock-funded deal.
Regulators in Europe and the UK blocked it, and in December 2023 the two sides terminated the merger. Adobe paid Figma a $1 billion break fee, recorded in fiscal 2024 operating expenses [21]. The true cost ran higher than the headline fee. Because the payment was not tax-deductible, it added $210 million to Adobe's fiscal 2024 tax provision rather than shielding any of it [22], and it generated a $1.15 billion capital-loss carryforward against which the company took a valuation allowance — meaning it does not expect to realise the offsetting tax benefit [23]. In total, the terminated deal cost Adobe more than $1.2 billion — the $1 billion fee plus the $210 million of added tax, with no offsetting benefit from the capital-loss carryforward.
Figma cuts against the tidy read of the rest of the record in a specific way. The same management that sizes its completed deals to immateriality was willing, once, to pay a full, franchise-scale multiple for a company it saw as both a threat and a complement — and the discipline held only because antitrust authorities, not Adobe, stopped it. The record carries two signals: the default is restraint, and the ceiling on what the company will pay when it feels strategically cornered is high.
What the Record Implies
On balance the M&A history supports rather than undermines the case for trusting Adobe with capital — the qualifier being that the support rests on the absence of failure rather than on demonstrated returns. The deals are small relative to the buyback, concentrated in the segment they were meant to build, integrated without a single write-down, and now largely amortised. Management has funded its generative-AI response internally through R&D rather than by buying a model company, and its most recent move — Semrush at $1.87 billion in April 2026 — is a return to the immaterial-tuck-in template after the Figma detour [24].
The strongest counter-fact sits inside the same record: Figma proved the ceiling on Adobe's willingness to pay is a franchise-scale, ~50x-revenue multiple, and only a regulator enforced the discipline the balance sheet otherwise displays. Two things would change this read. A goodwill impairment — or a fresh $10-billion-plus, stock-funded acquisition — would signal the restraint had broken. Continued cadence of cash-funded tuck-ins alongside internal build would confirm it. For a franchise whose value rests on converting software into compounding per-share free cash flow, how management spends the cash it does not return is not a side issue; on the evidence to date, it has spent it carefully, with one expensive, regulator-corrected exception.
Reconciling the case
The seven chapters before this one built the pieces: a 96%-recurring software franchise converting roughly 40% of revenue to cash, a moat resting on file-format standards and an 850-million-user installed base, cash that is real after stock compensation, a price that implies almost no growth, rivals growing three to four times faster in adjacent pools, and buybacks that retire stock counter-cyclically. This chapter puts them together — as three scenarios for the next decade, an answer to whether revenue will be higher in ten years, and a set of signposts that would move the read.
Market Cap ($B)
SBC-Charged FCF Yield
Total ARR ($B)
ARR Growth YoY
Sources: market cap and owner-cash yield derived from reported financials and current price [1]; ARR and its growth from the Q2 FY2026 earnings call [2].
Put in plain words, the market's near-zero number describes the whole enterprise, not a share. Adobe's roughly $95 billion equity value is consistent with owner cash flow growing about 0% a year in perpetuity even on the conservative stock-comp-charged basis (an ~8.3% SBC-charged trailing free-cash-flow yield, down from a ~10.4% headline), yet because Adobe retires 4-7% of its shares each year by repurchasing at about 9x free cash flow, per-share owner free cash flow still compounds mid-single-digits on flat aggregate cash — so the stall the price embeds applies to the whole company, not to the owner of a share [3]. What the ~0% is: a statement that aggregate free cash flow never grows again. What it is not: a statement that per-share owner cash flow stops rising. At about 4.5–5% annual share retirement, flat aggregate free cash flow of ~$10 billion turns into roughly +58% per-share free cash flow over a decade — about 4.7% a year — and the ~8.3% SBC-charged yield is the honest entry yield underneath it. The counter-fact belongs in the same breath: the fiscal 2025 buyback ran about 115% of free cash flow, part-funded by roughly $2.0 billion a year of note issuance [4], so continued retirement at that pace assumes free cash flow and the ~45% operating margin hold.
The case, then, is a high-single-digit cash yield on a franchise that is decelerating but not shrinking, where per-share compounding does much of the work; the case is most sensitive to whether generative AI erodes the creative base over a ten-year horizon.
What Adobe is, and what went wrong
Adobe sells the software professionals use to make and manage content: Creative Cloud (Photoshop, Illustrator, Premiere) and Document Cloud (Acrobat) inside the Digital Media segment, and the Experience Cloud marketing suite inside Digital Experience (The Cash Franchise, Digital Experience). Revenue was $23.77 billion in fiscal 2025, roughly three-quarters Digital Media and a quarter Digital Experience, and 96% of it recurring subscription. Free cash flow was $9.85 billion, a 41% margin, on capex under 1% of sales [5].
What went wrong is a repricing, not a stumble in the numbers. The shares fell about two-thirds from their November 2021 peak while free cash flow rose roughly 43%, leaving the stock near a 10.5% headline free-cash-flow yield (The Cash Franchise). Three things drove the derating. Generative AI arrived as a genuine technology shift, and the fiscal 2025 10-K for the first time lists "AI-first" creativity and productivity tools among Adobe's competitors [6]. The $20 billion Figma acquisition was abandoned in 2023, and the rival Adobe tried to buy now grows 41% with 136% net dollar retention [7]. And from fiscal 2026 Adobe collapses its three reportable segments into two customer groups, removing the standalone Digital Media growth line just as the competitive question sharpens (Sizing the Rivals).
The tension, as shared facts
The bull and bear read the same numbers differently. Each row below is a fact from the filings, not a sentiment.
| Shared fact | Bull reading | Bear reading | What would decide it |
|---|---|---|---|
| ARR $27.1B, +12.5% YoY (Q2 FY2026) | Double-digit growth persists; guidance was raised, not cut | Growth includes Semrush and FX; organic pace is slower and still decelerating from ~19% five years ago | Organic net-new ARR trend once Semrush laps and FX is stripped |
| Price implies ~0% long-run owner-FCF growth | The market prices a stall the business is not showing | The market has correctly repriced a decelerating, AI-exposed franchise | Whether ARR growth holds double digits or fades toward mid-single |
| Figma +41%, 136% NDR; Canva ~$4B ARR, +35% | Rivals win adjacent UI/UX and prosumer pools, not Adobe's imaging/video core | Enterprise design budgets are compounding on a rival at 136% retention | Whether that retention spreads from interface design into imaging and video |
| Buyback retired ~7% of shares in FY2025 at ~9x FCF | Per-share cash compounds even if the business only holds | Repurchasing above FCF, part-funded by debt, is not free | Whether margins and FCF fund the buyback without rising leverage |
| ~45% operating margin, undisclosed segment profit | Margin durability protects cash flow in any growth case | Deferring price increases to chase users can pressure margin later | Consolidated operating margin holding near 45% |
Sources: ARR and growth drivers, Q2 FY2026 earnings call [8]; Figma metrics, FY2025 10-K [9]; buyback and margin, Adobe FY2025 10-K [10]; Canva figures privately reported and unaudited.
The most recent print leans against the stall. In Q2 fiscal 2026 Adobe posted record revenue of $6.62 billion, up 13%, and raised its full-year non-GAAP EPS target to $24.35–$24.45 from the $23.30–$23.50 it set a quarter earlier, with the ARR growth target held at 10.2% [11][12]. Two signals cut the other way in the same call: a $70 million goodwill impairment on the Publishing and Advertising unit, and management's decision to "defer previously planned Creative Cloud line optimizations" — that is, to hold back price increases — in order to accelerate free-tier user growth [13]. Choosing volume over price is a reasonable response to Canva and free AI tools; it is also a tell that pricing power in the creative core is being managed, not simply exercised.
Three paths for the next decade
The scenarios below hold Adobe's ~40% free-cash-flow margin roughly constant and vary the pace at which revenue compounds from a fiscal 2026 base of about $26 billion. They are illustrative bands, not forecasts.
Source: derived from a fiscal 2026 revenue base of ~$26.0B (company guide midpoint) compounded at the stated rates; margin held near 40% [14].
Bull — AI is additive (revenue compounds ~10%). The guide holds for the decade: Firefly, Acrobat AI Assistant and the freemium funnel convert the 850-million-plus user base into paid AI seats faster than rivals erode the professional core. Revenue reaches roughly $67 billion and free cash flow roughly $27 billion by fiscal 2036. Early evidence exists but is small — Firefly ending ARR is approaching $300 million and Acrobat AI Assistant ARR grew about threefold year over year, against a $27 billion book [15].
Base — a growth ceiling, not a cliff (revenue compounds ~5%). The installed base renews at double digits while challengers keep the faster-growing new pools, so aggregate growth fades from ~10% toward mid-single digits as the mix matures (Sizing the Rivals). Revenue reaches roughly $42 billion and free cash flow roughly $17 billion. This is the scenario most consistent with the five-year ARR deceleration and the competitive evidence on the table.
Bear — substitution bites (revenue holds flat). Generative tools commoditize enough of the creation step that net-new demand routes around Creative Cloud and the base stops expanding; margin protects cash flow, so free cash flow holds near $10 billion but stops compounding. At that point the ~8.5% owner-cash yield is close to the whole return, plus whatever the buyback adds.
The per-share overlay is what makes even the bear case tolerable for a cash-focused owner. Adobe retired about 7% of its shares in fiscal 2025 and has roughly $27 billion of repurchase authorization remaining after a fresh $25 billion approval in April 2026 [16][17]. Retiring 4–5% of the count each year turns even flat aggregate free cash flow into per-share free cash flow that compounds at a mid-single-digit rate. The reverse-DCF's "priced for a stall" reading applies to the whole company; the owner of a share sees the buyback work against it (Implied Growth, Capital Allocation).
The ten-year revenue question
The reader's standing test is whether revenue in year ten can be called higher than today with roughly 90% confidence. The evidence supports better than that — not because growth is assured, but because a decline requires the harder thing.
For fiscal 2036 revenue to sit below fiscal 2026's ~$26 billion, the compound growth rate has to be negative: the $27.1 billion ARR book would have to shrink, net of every new seat and price increase, for a sustained stretch. Three facts set that bar high. The revenue is 96% recurring, so a year's result is largely last year's book plus net change, not a fresh sale each period [18]. Remaining performance obligations of $22.27 billion — most of a year's revenue — are already contracted at the last quarter-end [19]. And the competitive record shows rivals capturing new design pools rather than pulling out Adobe's installed base, which still renews at double digits (Creative Cloud Moat, Sizing the Rivals).
Source: derived from a ~$26.0B fiscal 2026 base compounded at 10% (bull), 5% (base) and 0% (down); the "down" path is the threshold the 90%-confidence test must clear [20].
The honest caveat runs the other way. A ten-year horizon is long enough for a platform shift to compound, and Adobe's own choice to defer price increases in favor of user growth signals that it feels the pressure inside its pricing decisions, not only in adjacent markets [21]. The read here is that revenue is very likely higher in a decade because the base is contracted, recurring, and renewing, and a decline needs sustained net contraction that no year of the subscription era has produced. What would lower that confidence: net-new ARR turning negative for consecutive quarters, or the freemium user base — the top of the funnel — ceasing to grow.
Weighing the Case
Stated once, plainly: the appeal is a durable cash franchise available at a high-single-digit owner-cash yield, where per-share compounding does not depend on the growth the market is worried about. On stock-compensation-charged free cash flow the yield is about 8.5% and rising as the cash base grows, above the reader's 8% floor; the buyback shrinks the share count counter-cyclically at roughly 9x free cash flow; and the freshest quarter shows management raising guidance rather than defending it (Implied Growth, Capital Allocation) [22]. The catalyst, to the extent there is one, is not a product launch but the arithmetic of a stressed multiple meeting continued repurchase: if double-digit ARR growth persists even a few more years, the gap between a ~10x cash multiple and the growth being delivered closes in the owner's favor.
The strongest fact against the case is that the derating is not obviously an overreaction. Sell-side has moved with the price to a Hold, with at least one Underperform and a $190 target on AI competition (Implied Growth); Figma compounds enterprise design spend at 136% retention while Adobe stops disclosing its own Digital Media growth; and generation — the step AI most directly commoditizes — is where the challengers are fastest. This is not a fear-driven selloff detached from the fundamentals; it is a repricing of a real, if unquantified, risk to the base. What would change the read toward the bear case is straightforward and named in the signposts below.
What to watch
Each item is checkable in a specific filing, with a threshold that would move the read.
| Signpost | Where it appears | Threshold that changes the read |
|---|---|---|
| Total ARR growth (organic, ex-Semrush, constant currency) | Quarterly earnings call, ARR disclosure | Falling below high-single digits after Semrush laps |
| Freemium / MAU growth | Earnings call growth drivers (Acrobat, Express, Firefly web/mobile) | The top-of-funnel user base ceasing to grow |
| Firefly and Acrobat AI Assistant ARR | Earnings call, AI monetization lines | Failing to scale from ~$300M toward a segment-moving figure |
| Consolidated non-GAAP operating margin | Earnings release, guidance | Sustained slippage below ~45% as price increases are deferred |
| Buyback pace vs FCF and leverage | Cash flow statement, debt footnote | Repurchases funded by rising debt rather than cash generation |
| Figma net dollar retention and $100k+ customers | Figma 10-K, key business metrics | Retention above 130% spreading into imaging/video categories |
Sources: Adobe metrics per the quarterly earnings calls and FY2025 10-K [23][24]; Figma metrics per its FY2025 10-K [25].
The signposts share a spine: they measure whether the installed base keeps renewing and the funnel keeps filling, because that — not next quarter's revenue — is what separates the base case from the bear.